Set the Schools Free on KCUR 89.3!

In October Set the Schools Free was featured on KCUR in a segment by education reporter Elle Moxley on changing perceptions and enrollment patterns for public schools within KCPS boundaries:  “More School Choice Might Be Keeping Middle Class Families in Kansas City”.

Here are some highlights:

  • A growing number of middle class families, encouraged by new public school options, are choosing to stay in KC rather than move to the suburbs when their children reach school age
  • There’s been an increase in overall K-12 enrollment over the last three years, driven by growth in charter school enrollment (and despite an overall decline in school-aged population, according to Census Data compiled by the City of Kansas City, MO).
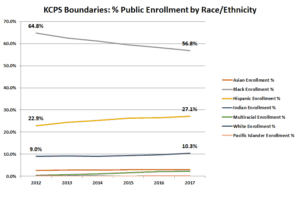
  • While Hispanic enrollment and white enrollment are growing, African-American enrollment is decreasing.

Click here to read the full story.

Share

Introducing the KC Public High School Enrollment Dashboard

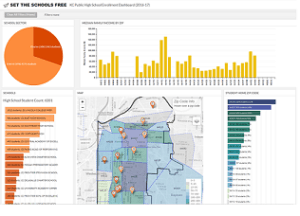
There’s a lot happening right now in our public high school sector. Set the Schools Free is excited to announce the launch of its KC Public High School Enrollment Dashboard to help inform the conversation.  

Where are our public high schools located? How many students attend them, and from what zip codes? What does income disparity look like across our community – and how is it reflected in our public high schools?

Set the Schools Free has developed an interactive mapping tool to help answer these questions.

The Kansas City Public High School Enrollment Dashboard combines  1) 2016-2017 high school enrollment data for public high schools within KCPS boundaries, with 2) student zip code and 3) US Census median family income data to paint a more comprehensive picture of our public high school landscape.

Together, these data can help foster a better understanding of Kansas City’s public high schools and the student populations they’re serving.

How it Works

The dashboard is a (desktop) discovery tool. For example, maybe you want to better understand the enrollment profile of a specific school or set of schools.

Or you’re curious about the charter/KCPS breakout at the high school level, and from which zip codes the different sectors draw their student populations.

Perhaps you want to know which schools are serving students in a particular zipcode, how many students attend public school in that zipcode – and what the median family income in that zipcode is.

The dashboard allows you to filter on enrollment data by school sector, school(s) and zip code(s) to better understand these relationships.

  • By School Sector. Click on the pie chart to see the size of each sector, a list of schools in each sector, the number of students served, student zipcodes, and the median incomes of those zip codes.
  • By School(s). Click on an individual school to see how many students attend that school, the zip codes in which they live, and the median family income for that zipcode.
  • By Zip Code(s). Click on a zip code to see median family income, how many students attend public schools in that zip code, and which schools they attend.

You can track the information you’re filtering on in the top left-hand corner of the dashboard. Want to start over? Click on the “clear all” button and it will bring you back to the landing page, and a high level view of our high school landscape.

AN IMPORTANT NOTE:  Because this enrollment data set is organized at the building level, enrollment numbers for three KCPS high schools – Lincoln, Southeast High, and Paseo – currently include middle school enrollment figures in addition to grades 9-12. For example, HS enrollment for Lincoln College Prep is 675 students. With grades 6-8 included this number jumps to 1022.

As a result, the dashboard inflates enrollment for these KCPS high schools, and for public high schools overall, by about 10 percent (521 students).

Because these enrollment numbers are tied to actual student zip codes, it’s important to leave the data intact if we want to understand the relationship between schools and the students they serve.  I hope to receive updated data from DESE soon.

Click here for precise 2016-17 HS enrollment figures by school.

____________________

For the best user experience, please view the dashboard on a desktop browser.

Please share this tool with others you think may find it of interest!

Share

Understanding Kansas City’s high school enrollment landscape

What does Kansas City’s high school landscape look like? How many public high schools are there? How many students do they serve? And what’s the KCPS/charter breakdown?

Welcome back to Set the Schools Free. There’s been a lot of activity in our public high school sector recently:

  • Southwest Early College Campus, a KCPS signature school, closed its doors in May 2016
  • Southeast High School re-opened in August 2016 for students from the AC Prep signature program and surrounding neighborhoods
  • Crossroads High School, the third school in the Crossroads Charter Network, welcomed its first class of 9th graders in August 2017
  • The Kauffman School, a grades 5-12 college prep charter school, grew to serve grades 9 and 10, and will serve grades 9-12 by August 2018
  • Academie Lafayette, a K-8 French language immersion charter school, is pursuing plans to open an International Baccalaureate (IB) high school
  • Kansas City Girls Preparatory Academy, a grades 6-12 charter school, plans to open in Fall 2019 with its first sixth grade class
  • The Uniting at Southwest initiative is pursuing a project-based public high school, in partnership with KCPS, at Southwest High School

With so much going on I’ve wanted to write something on high school for a while now – but was unsure where to begin.

So I decided to start with the facts. I wanted to know:  What does our high school landscape look like? How many public high schools are there? How many students do they serve? And what’s the KCPS/charter breakdown in the high school market?

I’ve put together a brief landscape analysis to help answer these questions. (Access this analysis by clicking on the graphic or link above). In summary:

  • School/student count. There are 14 public high schools (6 district, 8 charter) serving 5760 students within KCPS boundaries.
  • School size. KCPS high schools are significantly bigger than charter high schools. The median size of a KCPS high school is 667 students – three times the size of the median charter high school (220 students). The biggest high school is East High School, a KCPS school, which last year served 986 students. The smallest was Allen Village (162 students). (Note, the Kauffman School served only 9 & 10th graders in 2016/17, so wasn’t included in this comparison).
  • Market Share. Charter market share in the high school sector is smaller than in the overall K-12 market. 33% of all HS students (1903 students) attend charters; the remaining 66% (3857 students) attend KCPS high schools.
  • Sector Growth. Overall, our public high school enrollment is growing slightly, driven by existing charter school growth. As noted earlier, there are several new charter high school initiatives currently in the works.

______________________________________

This first-level analysis of high school enrollment data answered some of my big questions. I also wanted to know:  Where are schools located? Who’s attending public high school in our district? What zip codes do most students live in? And what does income disparity look like across our community – and in our schools?

Coming soon:  The Kansas City Public High School Enrollment Dashboard

I’m excited to share that Set the Schools Free will soon be launching an interactive mapping tool to help answer these questions.

The Kansas City Public High School Enrollment Dashboard brings together 2016-2017 high school enrollment data for public high schools within KCPS boundaries with student zip code and US Census median family income data to paint a more comprehensive picture of our public high school landscape.

The main function of the dashboard is discovery. For example, maybe you want to better understand the enrollment profile of a specific school. Or you’re curious about the charter/district breakout in high school, and from which zipcodes the different sectors draw their student populations. Perhaps you want to know which schools are serving students in a particular zipcode – or how many students attend public school in that zipcode.

With the dashboard you’ll be able to filter on enrollment data by school sector, school(s) and zip code(s) to better understand these relationships.

Together, these data can help foster a better understanding of Kansas City’s high school landscape, and the students and communities they serve.

So stay tuned – the enrollment dashboard is coming soon!

A couple of notes:  

1) Neither the landscape analysis nor enrollment dashboard currently address school performance. School quality is obviously a huge part of the high school conversation in Kansas City. If you’d like to know more about school performance and quality seats in our district, the IFF Kansas City Quality Schools mapping tool is a great resource. You can find it here.

2) If you’re a parent and are actively looking for high school options for your child, Show Me KC Schools is a great resource for helping locate and compare the range of school options (public and private) within KCPS school boundaries. In addition to providing up-to-date information on individual schools, they also conduct school tours and other events to connect parents and school communities. Check them out!

Share

Set the Schools Free on FutureEd: Finding the middle path in Indy

What’s the biggest take-away from IPS Innovation Schools? That urban ed reform doesn’t have to be a zero-sum game. There’s a middle path between district and charter. 

Following my last post on Indianapolis, I was invited to write about the changes underway in IPS in a more national context.

My latest writing, “Between District and Charter: Finding the Middle Path in Indianapolis”, is featured on FutureEd, an independent, solutions-oriented think tank at Georgetown University’s McCourt School of Public Policy.

This post offers more context about the changing public education landscape in Indianapolis and the motivations driving IPS Superintendent Lewis Ferebee to create in-district autonomous schools.

It also focuses more on two important pillars of IPS Innovation Network Schools that have particular relevance here in Kansas City:  1) a re-investment in neighborhood schools, and 2) a greater focus on accountability.

Bottom line? That school districts matter. And that charter schools, and the model of school-based autonomy they offer, aren’t always a threat – they can also be an opportunity.

____________

To learn more about FutureEd and its work to promote excellence, equity and efficiency in K-12 and higher education on behalf of the nation’s most disadvantaged students, click here

Share

“Blurring the lines” between district and charter schools in Indianapolis

Indianapolis Public Schools are “blurring the lines” between traditional public schools and charter schools, re-shaping how public education is organized and governed in Indy. 

Last week I had the opportunity to attend an education conference in Indianapolis, Indiana.

Organized by the Progressive Policy Institute in partnership with The Mind Trust and Education Cities, the conference was about changes underway in the Indianapolis Public School System (IPS) that are “blurring the lines” between traditional public schools and charter schools and are re-shaping how public education is organized and governed in Indy.

It’s a compelling story. IPS is embracing the idea of school autonomy in a traditional district context, using it as a lever for turning around failing schools, starting new schools, and for taking successful IPS schools to the next level. It’s capitalizing on its competitive advantage as a school district, and as the largest operator of schools and school buildings in Indianapolis, to bring this idea of school autonomy – coupled with rigorous accountability – to scale across the IPS system.

By doing this IPS has put itself back in the center of education reform in Indianapolis. Instead of trying to work around IPS, education organizations in Indianapolis – including some very well-established and successful Indy charter schools – are now actively pursuing partnerships with the district.

Participating schools and school leaders get access to IPS buildings and valuable support services – like special education and transportation – at no cost. This frees up time and dollars to focus on the school’s mission, rather than on operations.

In exchange, IPS gets to set the conditions of these partnerships. Because IPS owns the school facilities, it can direct operators to parts of the district that actually need new school options.

Schools that partner with IPS must participate in the district’s unified enrollment system.

And if they take over a failing neighborhood school, they have to commit to serving all of the students in the neighborhood, not just Kindergarten and first grade (this slow-start model is very common in school start-ups, for good reason – it works. But in a neighborhood context, it can be pretty disquieting. We visited a school and saw how this more inclusive start-up model worked in practice).

I know – this all sounds like crazy talk. But it’s not.

All of what’s happening in Indy is actually based on two simple ideas:  1) that it’s the educators in schools, working closest with students, who are best-positioned to make decisions in students’ best interests. That is, school leaders should actually be able to lead. And, 2) that “the district” can actually be set up to facilitate this mission-driven work, rather than hinder it.

Consensus around these two core ideas – fueled by a belief that the system, as currently set up, was not working – ultimately led to the passage of state legislation in 2014 that “blurred the lines” and created IPS Innovation Network Schools, now in their first year of operation in Indianapolis.

I’ll be writing more about these innovation schools – what they are, how they work, and who’s involved – in my next few posts.

In the meantime, though, I think what’s most heartening about what’s happening in Indy – and what I was most excited to come home and share – is that there’s a city, very similar to Kansas City in many ways, that’s trying to forge a sustainable middle path between an all charter and all-traditional district – a path, I’m convinced, that’s ultimately much better for students and families. And it’s Indianapolis Public Schools that’s leading the charge.
Share

Choose your own adventure (the public education version)

With charter sector enrollment nearing 50%, public education within KCPS boundaries is approaching a crossroads. Which path forward is best for students?

Last month, I shared updated enrollment data for the 2016-2017 school year. Charters now enroll 45% of all public school students within our district.  50% of all kindergarten students attend charter schools. 60% of public school students within KCPS boundaries attend schools requiring an application (either charter or KCPS signature).

So what’s next for public education in Kansas City? Where are we headed?

I’m not sure. But a recent post from Neerav Kingsland, author of the blog Relinquishment, helped clarify my thinking on the choices available to Kansas City as our charter sector continues to grow.

In his post “Charters growing in your city? You have 5 options”, Kingsland offers a useful framework for understanding the options available to districts, like ours, with high charter market share.

These cities, he suggests, “will have to evolve their educational systems to govern a mixed portfolio of school types”. Drawing on examples of other urban districts, he outlines five potential paths forward:

  1. Implode (Detroit)
  2. Compete (Washington, DC)
  3. Coordinate and Collaborate (Denver)
  4. Blur the lines (Indianapolis & Camden)
  5. Govern (New Orleans)

Some of these options, he points out, “will be much better for children than others”.  You can read his full post here.

So, where does Kansas City currently fall among these options?

Or maybe the better question is:  Going forward, which path do we want to be on? Which path is best for Kansas City’s students and families?

_________________

I’ve gathered a few links to background articles about each city, for those who may be interested in learning more. This list isn’t meant to be exhaustive; if you’d like to recommend other articles, please leave them in the comments section.

Detroithttp://educationnext.org/fixing-detroits-broken-school-system/

Washington DC: http://educationnext.org/d-c-students-benefit-mix-charter-traditional-schools/

Denver:  http://educationnext.org/denver-expands-choice-and-charters/

Camden:  http://www.njspotlight.com/stories/16/08/18/some-improvement-seen-in-camden-schools-blip-or-new-beginning/

Indianapolis:  http://www.wfyi.org/news/articles/explaining-indianapolis-public-schools-plan-for-school-autonomy

New Orleans:  http://educationnext.org/new-orleans-case-all-charter-school-districts/


Share

If you love something, set it free

Charter schools serve almost half of all public school students within KCPS boundaries. Rather than focusing on them as a problem, what would happen if we instead thought of them as an opportunity?

I’ve written a lot in the past year about Kansas City’s growing public charter sector.

I’ve tried to use data, wherever possible, to illuminate our changing public schools landscape. Because I think once we come to terms with charter schools and choice, it opens us up to having much more productive and meaningful conversations about public education in our school district, and what a really good system of schools could look like.

45% of public school students within KCPS boundaries are now in charter schools. So we’re past the point of questioning whether charter schools should exist. They do.

And worrying that charters (and the parents who choose them) are ruining public education doesn’t solve any problems: it doesn’t improve KCPS academic performance, or increase KCPS enrollment. It doesn’t improve the academic performance of charter schools, or make them more integrated. And it doesn’t get us any closer to a system of public schools that serves all students, and serves all students well.

We need to be more solutions-focused.

As we think about public education in Kansas City going forward, I wonder if the charter school model, and the flexibility it provides, might actually be one of the most significant tools we have to keep “public schools public” – and to get families of all colors, backgrounds and incomes invested, together, in our public education system.

Or, put another way, there’s a well-known quote that says, in part:  “If you love something, set it free.” If we hold on too tightly to an idea of what we think public education has to be, or should look like, do we risk losing it altogether?

__________

P.S. Happy birthday to Set the Schools Free! It was around this time last year that I put up my first blog post.  Thank you for reading.


Share

2016-2017 Enrollment data for all public schools within KCPS boundaries

Preliminary 2016-2017 enrollment data for Missouri public schools are out! These data are still being finalized, but can give us a pretty good idea of what’s happening in our district in the meantime.

Click here or on the below graphic for an updated overview of public school enrollment trends within KCPS boundaries, including breakdowns by sector, grade segment, and public school type.

Here are a few highlights from the 2016-2017 school year:

  • Total public school enrollment increased by 3%, to 25,839 K-12 students.
  • KCPS enrollment declined by 2%, to 14,240 students. 55% of all public school students attend KCPS schools.
  • Charter sector enrollment increased by 8%, to 11,599 students. Charters now represent 45% of public school enrollment.
  • 50% of all kindergarten students attend charter schools.
  • Nearly 60% of all public school students attend a public school, either KCPS signature or charter, that requires an application to attend.

You can find the raw enrollment data, by both district and building, on DESE’s website.

Share

The gift of data, part II: Getting comfortable with parent choice

Almost 60% of public school students in our district attend “schools of choice” – schools that require an application to gain admittance.

After posting “The gift of data” a few weeks ago, a reader suggested it would be valuable to break down school enrollment by public school type -KCPS Neighborhood, KCPS Signature, and Charter – to see what those numbers are doing.

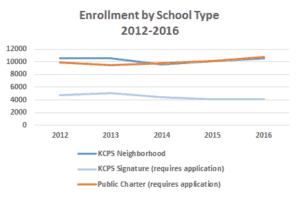
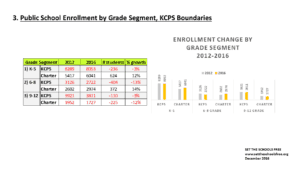
I agree! Here are the enrollment numbers for the 2011/12 through 2015/16 school years, broken down accordingly. (Click here for a bigger, easier to read version of these numbers + graphs.)

The total enrollment trend line for this five-year period is flat. After taking a dip in 2012/13, charter school enrollment grew the most. KCPS neighborhood school enrollment, after a significant drop in 2013/14, began to rebound; and KCPS signature school enrollment declined overall.

But what’s most striking to me, when you break these numbers out by school type and do the math, is that more than half of all public school students in our school district attend either a public charter school or a KCPS signature school.

Yes, that’s right – almost 60% of students attend public schools that require an application to gain admittance. Or, put another way, more than half of public school students in our district attend “schools of choice”.

Of course KCPS signature schools are not charter schools – like neighborhood schools, they operate under the KCPS umbrella and are governed by the KCPS School Board.

But, like charters, they 1) require an application to attend – parents and/or students must be motivated to apply; and 2) enroll students from across the district (in contrast to neighborhood schools, where enrollment is assigned based on where you live).

These are, it’s worth noting, enrollment practices for which charter schools are frequently criticized. But, here’s the thing: signature schools practice them, too.

The fact is, the majority of us who have children in public schools in this district have actually chosen where our kids go to school. Acknowledging this fact goes a long way, I think, to helping us get more comfortable with parent choice.


Share

The gift of…..public school enrollment data, KCPS boundaries

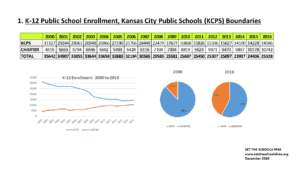
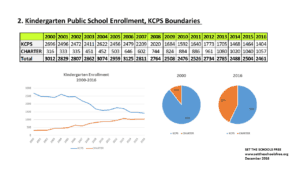
Happy Holidays from Set the Schools Free. As a 2016 wrap-up I’ve gathered and summarized the public school enrollment data for KCPS and charter schools that has informed my writing over the past year, making it more readily available in one post.  (Less talk, more numbers!) This data spans from 1999-2000, the first year charter schools operated in Kansas City, to the 2015-2016 school year.

Click here or on any graphic to access all 3 slides in .pdf format.

Note: “2016” is the 2015-2016 school year, not the current academic year. DESE will release 2016-2017 enrollment data in January 2017.

Happy New Year, and see you in 2017!
slide1slide2


slide3

Share