For the 5th year in a row, Set the Schools Free is publishing a one-page overview of K-12 public education within KCPS boundaries.
This, my friends, is no small task!
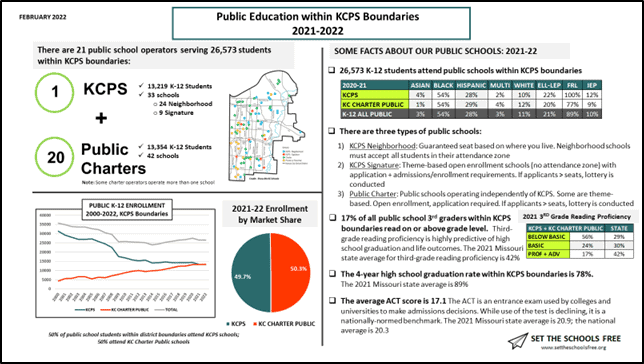
Drawing from multiple DESE data sets (and involving numerous failed attempts at creating decent-looking graphics) this 2021-22 overview includes basic information about the number of public school operators within KCPS boundaries (21); the number of K-12 students served (26,573 altogether, broken out by school sector) as well as student demographic and third-grade reading data.
And this year, for the first time, the overview includes the 4-year average HS graduation rate (78%) and ACT average (17.3), both benchmarked against the state.
Finally, the overview includes enrollment trend data from 2000 to this current 2021-22 school year. The year 2000 (the 1999-2000 academic year) is the first year charter public schools began operating in Kansas City, so it’s a good starting point to evaluate how the advent of independent public schools has changed our public education landscape over the past two decades.
Included below are links to summaries from previous years, going back to 2017-18. Each of the overviews are a bit different, including different information – so it’s worth taking a look through the years!
2020-21 K-12 Overview, KCPS Boundaries
2019-20 K-12 Overview, KCPS Boundaries
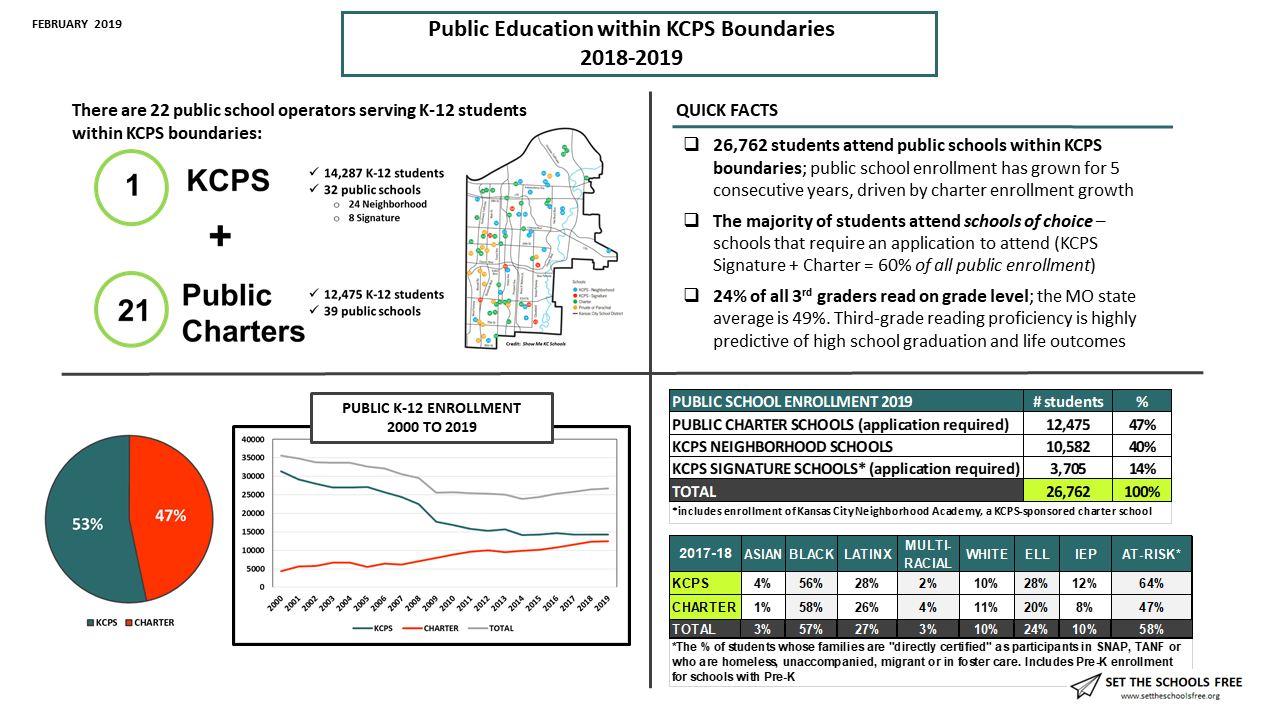
2018-19 K-12 Overview, KCPS Boundaries
2017-18 K-12 Overview, KCPS Boundaries
Questions/comments? Feel free to email me at Set the Schools Free.
Happy New Year, readers! It’s 2022 and there’s a lot to catch up on.
Accreditation’s the word
After a decade of being unaccredited or provisionally accredited, KCPS earned back full accreditation earlier this month. In making its decision, the Missouri State Board of Education cited the district’s progress in improving attendance, graduation rates, and academic growth. Stability was another contributing factor – with six years at the helm of the district, Superintendent Bedell is now the longest-serving KCPS superintendent in more than 50 (!) years. The district’s progress – and the leadership that’s enabled it – is a huge accomplishment for KCPS and a win for Kansas City.
But what Dr. Bedell said following the decision was as important as the decision itself:
“This is only the beginning…we can’t stay accredited on the path that we’re on right now. We’re antiquated, we’re outdated, we’re too rigid. And if covid didn’t teach us anything, here’s what it did teach us: that we’re not agile enough to really truly prepare these kids for the future they deserve. That means we have to dismantle this system, we have to redesign it…”
KCPS Superintendent Mark Bedell, January 11, 2022
His words were a good reminder for me of Set the Schools Free‘s central premise, and the reasons I started crunching data and developing this platform back in 2016. These were: 1) my abiding belief in traditional public education (and my concern that, as KCPS enrollment continues to decline, we’re in danger of losing something important); and 2) the powerful idea that decisions affecting students should be made in schools, closer to students.
Agile: 1) Able to move quickly and easily; 2) relating to or denoting a method of project management that is characterized by the division of tasks into short phases of work and frequent reassessment and adaptation of plans.
Making decisions closer to kids is, of course, a hallmark of charter public schools. And a lot of people don’t like charter schools! But regardless of how you may feel about charters (which are public schools that operate independently of school districts) there’s something we can learn from them.
Because the flexibility charters enjoy in decisionmaking – their ability to make decisions at the school-level, closest to kids – is key to their agility, and is one of the most important operational advantages they have over traditional public schools (where decisions, in contrast, are often made centrally, to maximize system-wide efficiencies).
If you’re interested in exploring this idea more, I’ve written about it here, here, here and here.
But accreditation aside, enrollment numbers reflect the real choices families are making. That why Set the Schools Free is kind of obsessed with them – and is so committed to sharing them with you!
Enrollment reflects real choices
Which brings us to K-12 enrollment, and the recently released 2021-22 enrollment data. Here are the big headlines:
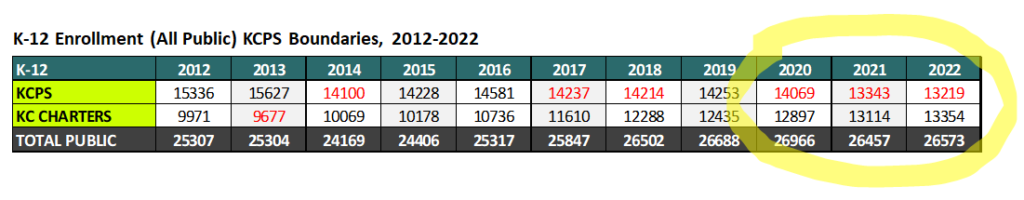
Years in which K-12 enrollment decreased for either sector are in red
Public School is back in session. Well, kind of. After a covid-related dip in 2020-21, overall 2022 K-12 enrollment bounced back slightly, driven by growth in charter enrollment
KCPS enrollment decreased by 7% over the last three years. KCPS K-12 enrollment decreased from 14,253 in 2019 to 13,219 in 2022. The biggest drop, in 2020 (+700 students), was pandemic-related, with Kindergarten experiencing the greatest decline (-306 students).
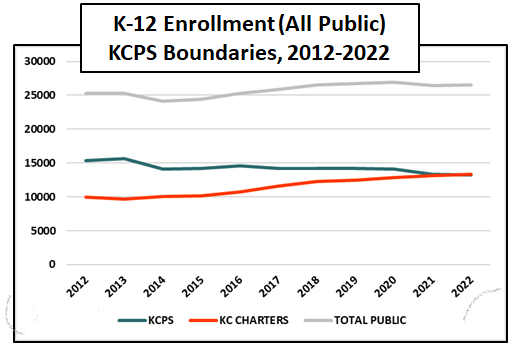
And charter public enrollment grew by 7% during this same period. Enrollment in charter public schools grew by 7%: from 12,435 to 13,354 between 2019 and 2022. Overall, charter enrollment has actually grown for the last nine consecutive years (even with the closure of six charter schools during this period). Enrollment growth in the charter sector has been the main driver behind growth in overall public school enrollment (overall K-12 enrollment has grown by 5% since 2012).
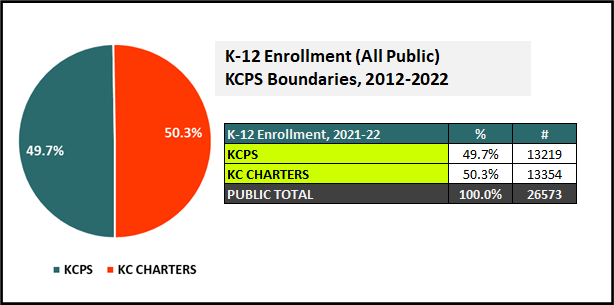
We’ve reached the tipping point
As a result, we’ve now hit the K-12 tipping point. We were essentially at 50-50 enrollment last year. But for the very first time this year there are, collectively, more K-12 students enrolled in charter public schools than in KCPS schools.
(Note: KCPS continues to be the biggest operator of public schools within our district boundaries. The second largest operator, Frontier Charter Schools, serves 1,556 students, followed by Guadalupe Centers (1,395) and then Academie Lafayette (1,244 students).
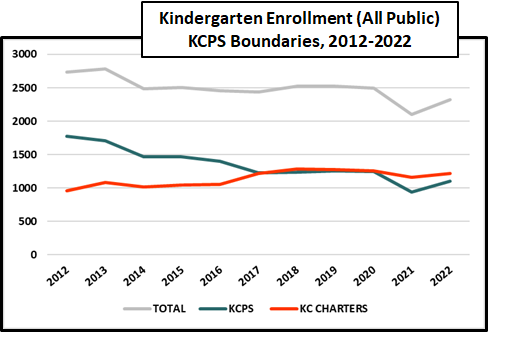
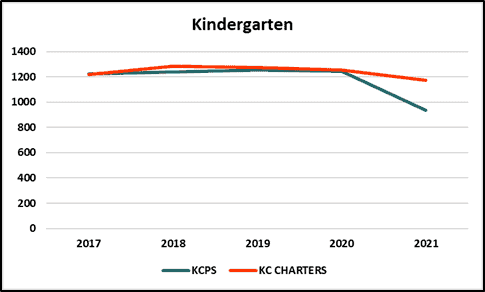
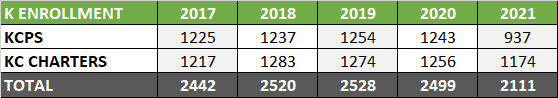
The Kindergarten enrollment gap has widened. Kindergarten enrollment is a leading indicator for our system of schools overall. We hit the K tipping point back in 2018 (something I originally wrote about in one of my first posts on Set the Schools Free). This gap widened during the pandemic.
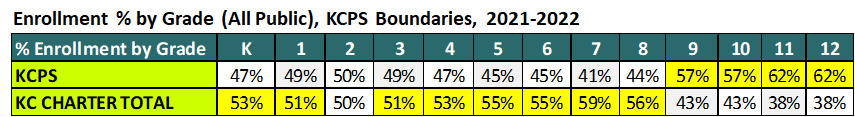
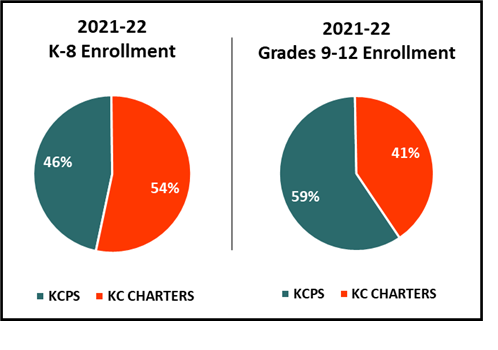
And finally, charter schools now dominate K-8 enrollment. KCPS continues to make up the majority of Grades 9-12 enrollment.
Majority enrollment is highlighted in yellow
Put another way:
The majority of all K-8 students now attend charter public schools; the majority of all HS students are enrolled in KCPS schools
Why should we care about enrollment? I really can’t say it enough: enrollment numbers reflect the real choices parents and caregivers make about public schools within KCPS boundaries – not the choices we might want them to make.
KCPS is now accredited, and that deserves celebration. But as of this school year, the reality within our district boundaries is that families of more than half of all K-12 students have chosen charter public schools to educate their kids. These charter schools are underfunded compared to their KCPS counterparts and, in the eyes of many, lack the legitimacy we give to traditional public schools – regardless of how they might perform.
This “outdated, rigid” thinking isn’t fair to charter school students or teachers. It also holds us back in our ability to learn from what works and to evolve our thinking. But most importantly, it holds us back in designing a more equitable, transparent, and accountable system that serves all students well.
Coming soon (hopefully): An updated 2021-22 KC Public Enrollment Dashboard, along with a dive into some demographic data.
What does 50% charter enrollment look like by grade-level?
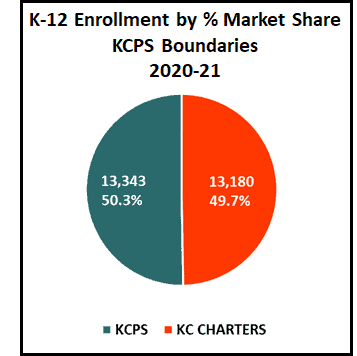
In 2020-21, Kansas City finally hit the tipping point between KCPS and KC Charter Public Schools, with KC Charter enrollment reaching 50% (well, 49.7%) of all K-12 public enrollment.
Click above for a 2020-21 snapshot of public education within KCPS boundaries
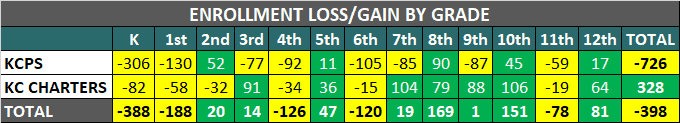
This shift in K-12 enrollment was no doubt accelerated by the coronavirus pandemic – KCPS lost more students between the 2019-20 and 2020-21 school years (-726) than it has in any single year since right-sizing under Superintendent Covington in 2010-11, when enrollment dropped by -1,042 students.
Charter enrollment, which has grown consistently for the past eight years – and which grew in 2021 by +328 students – was driven in part by schools that continue to add new grades. But bringing decision-making down to the school level also enables charter schools to be more agile and responsive to student needs, which no doubt gave them an operational advantage during an exceptionally challenging school year.
But reaching 50/50 enrollment didn’t happen overnight and the fact that we’re here is no surprise: I wrote about the impending tipping point five years ago in my first post on Set the Schools Free, and have been banging the enrollment drum ever since – because enrollment reflects the real choices families are making – not the choices we think they should make. We need to respect these choices, and recognize that they’re telling us something about what parents want from our system of public schools.
These choices also matter because they have real consequences for equity, transparency and accountability in public education in our district, both now and in the future.
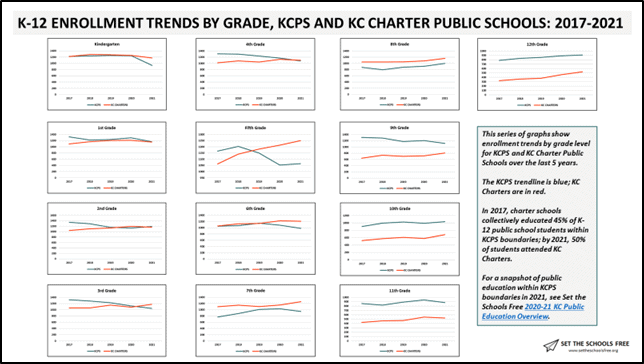
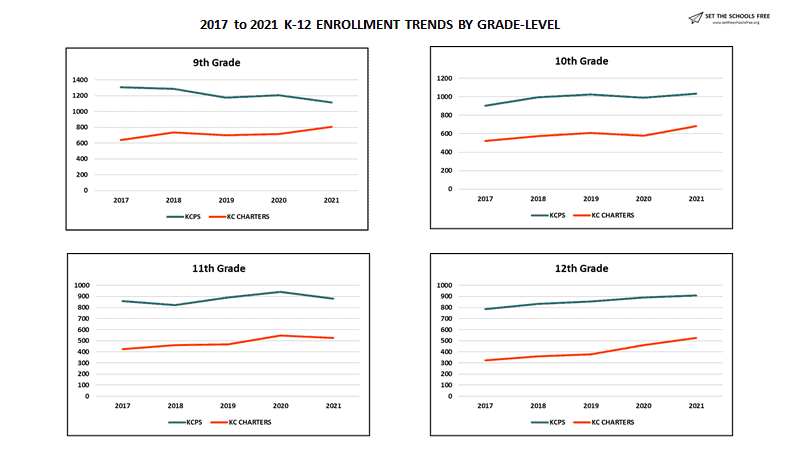
So, what does 50/50 enrollment in look like in Kansas City, by grade level? Here’s the big picture:
(Click on the graphic above and zoom in for a bigger version)
(Note: You can find these individual graphs, with data and analysis, sprinkled throughout my previous three posts on 2020-21 enrollment data).
In 2017, KC Charter schools enrolled 45% of all K-12 students; by 2021, that number reached 50%. As you can see from the graphs, we’ve hit or surpassed the tipping point in most K-8 grades, with KC Charter enrollment meeting or exceeding KCPS enrollment; in grades 9-12 KCPS continues to have market dominance.
Questions, comments? Feel free to contact me through Set the Schools Free.
While K-12 enrollment within KCPS boundaries decreased, overall, during the 2020-21 school year, KC Charter enrollment actually grew. KCPS enrollment also grew in several grades. In which grades did we gain students?
There’s a lot of discussion, both here in KC and across the country, about drops in student enrollment due to covid-19, and it’s academic and financial impact on our public schools.
Our school district is no exception. Within KCPS boundaries, enrollment is down, overall – by 1.6%. Kindergarten and first grade sustained the biggest losses, followed by 4th, 6th, and 11th grades. Enrollment in these grades is down in both KCPS and charter schools.
You can find this analysis in my last post, and an overall summary of 2020-21 enrollment here.
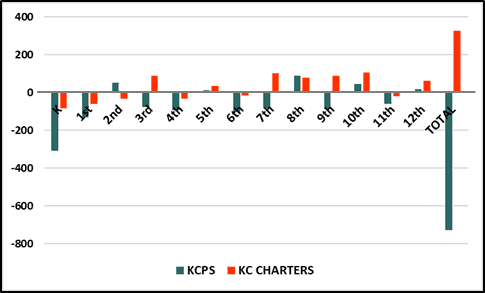
But in other grades we actually gained enrollment compared to 2019-20, at least marginally. Charter school gains were actually bigger than enrollment losses, resulting in overall growth. And grades 5, 8, 10 and 12 grew in both KCPS and the charter sector, with the biggest gains coming in 8th grade.
Altogether, enrollment changes from 2019-20 to 2020-21 look like this:
KCPS sustained 80% of K-12 enrollment loss; 76% of overall growth came from Kansas City’s charter sector.
So what does enrollment in these grades look like over the past five years, and what’s been the impact of the coronavirus compared to previous years? Let’s take a look.
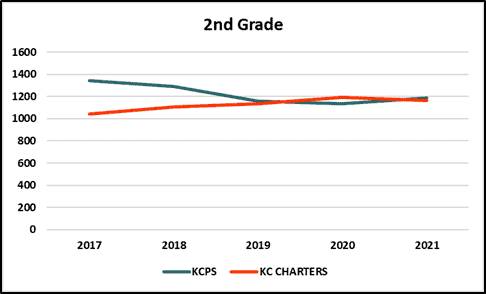
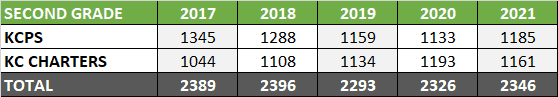
2nd Grade
2nd grade: + 20 students
After shrinking for several years in a row, KCPS enrollment grew in 2021 (+52)
Charter enrollment declined in 2021 (-32) after several years of growth
Overall, there are fewer 2nd grade students attending public schools within KCPS boundaries in 2021 than in 2017
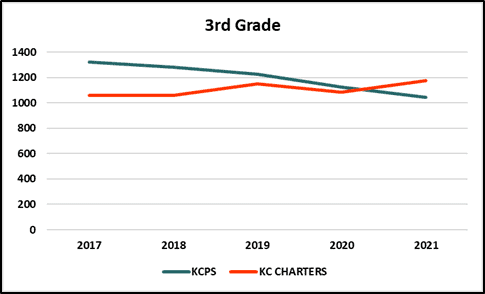
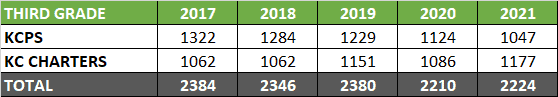
3rd Grade
3rd Grade: +14 students
KCPS third-grade enrollment has declined steadily since 2017 (-275 students, a -20% drop)
Charter enrollment, overall, has grown during this period (+115 students, an 11% increase)
In 2021, there are now more 3rd graders in charter schools than in KCPS schools
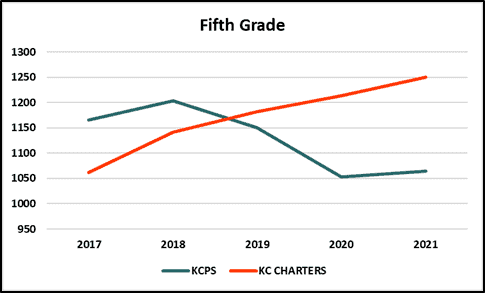
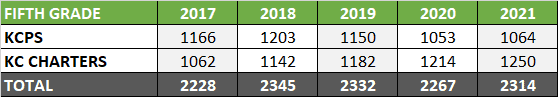
5th Grade
5th Grade: + 47 Students
5th grade charter enrollment has grown steadily since 2017 (+188 students, an 18% increase over time)
KCPS enrollment declined overall, with a significant drop between 2018 and 2020
Overall, there are more 5th graders enrolled in public schools within our district boundaries in 2021 than in 2017
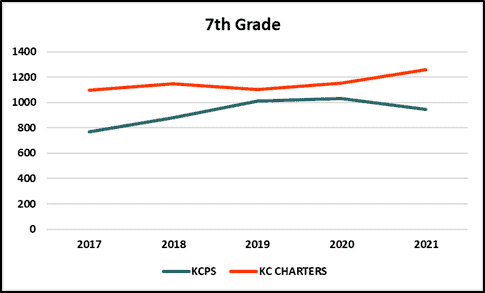
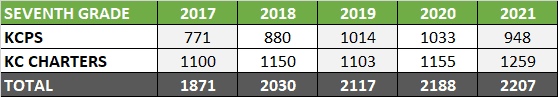
7th Grade
7th Grade: +19 Students
There are more 7th graders in 2021, overall, than there were in 2017 (+336, 18% growth)
There are more 7th graders in charter schools than in traditional public schools
While 7th grade charter enrollment grew in 2021 (+104 students, 9% growth), KCPS 7th grade enrollment declined (-85 students, -8% decline)
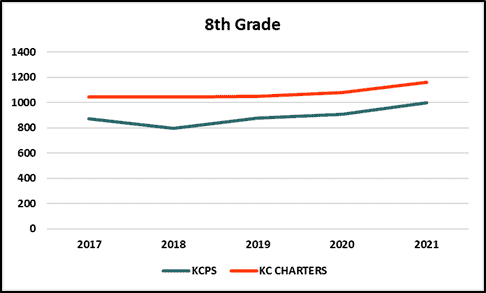
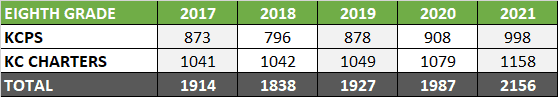
8th Grade
8th Grade: +169 Students
There are more 8th graders, overall, in 2021 than in 2017
8th grade enrollment in both school sectors grew in 2021
There are more 8th graders in charter schools than there are in KCPS schools
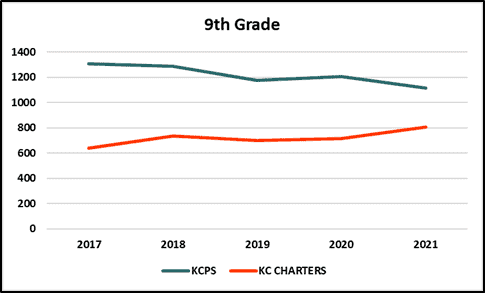
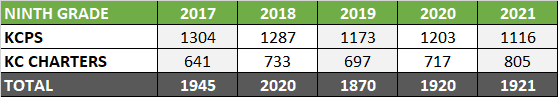
9th Grade
9th Grade: +1 Student
In 9th grade, enrollment held steady, overall. KCPS lost 88 students and charters gained 89
From 2017, KCPS enrollment declined and charter enrollment grew. Altogether there are slightly fewer 9th graders in 2021 than in 2017
From K-8, enrollment between KCPS and charters is competitive; in many grades there are more students in charters than in KCPS. Starting with 9th grade, KCPS has clear market dominance. This continues through 12th grade
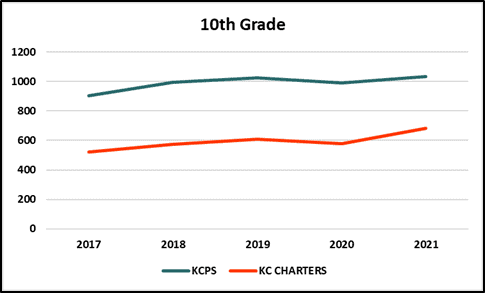
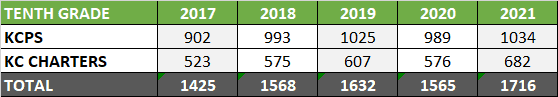
10th Grade
10th Grade: +151 Students
10th grade enrollment grew, overall, by 20% between 2017 and 2021
Both KCPS and charter 10th grade enrollment grew in 2021, with charter enrollment growing by more than 100 students
KCPS and charter growth follow the same trendline, overall
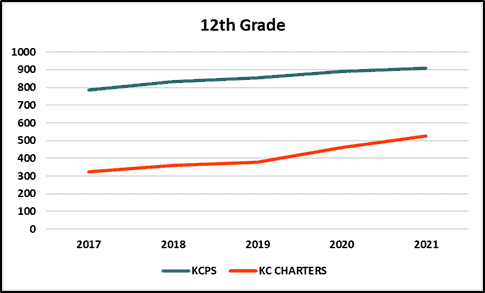
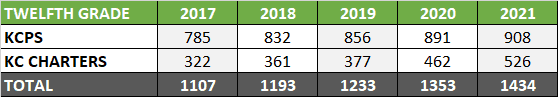
12th Grade
12th Grade: +81 Students
12th grade enrollment grew by 30% between 2017 and 2021; enrollment in both KCPS and the charter sector increased during this time
12th grade charter enrollment picked up in 2019, but KCPS and charters follow the same trendline, overall
In 2017, 71% of all high school seniors attended KCPS high schools; by 2021, that number had decreased to 63%
A few take-aways
In 2021, we either gained enrollment, or enrollment held steady, in most grades. In grades 5, 8, 10 and 12, enrollment grew in both KCPS and the charter sector. Overall, more than 75% of enrollment gains were in the charter sector, where K-12 enrollment has grown for the past eight years.
A couple of things strike me as I look at these grade-level analyses focused on enrollment gains.
Covid-19 has had a distinct impact – that is, a noticeable change in the five- year trendline – on KCPS enrollment in grades 5, 7 and 9. In the charter sector, this impact comes, mostly, in grades 2 and 10.
I’m also struck by the high school graphs, and how they differ from K-8. High school is the last grade segment in which KCPS has true market dominance.
In the next and final post in this 2021 enrollment series, we’ll dig in a bit more to the school-level data to determine what’s driving some of the changes in our K-12 enrollment landscape. And we’ll talk about the bigger implications of these changes for our system of public schools, going forward.
K-12 public enrollment within KCPS boundaries decreased this school year, after several years of overall growth. Which grades lost enrollment?
After several years of growth in K-12 public enrollment within KCPS boundaries, overall enrollment declined this school year. Although KC Charter enrollment grew, this growth was outpaced by enrollment loss in our traditional public school system, KCPS.
We’re now at a 50/50 split between the two sectors for K-12 enrollment – one of the highest charter public market shares in the country. You can find this big picture analysis in my recent post, K-12 Enrollment, 2020-21 (Part 1).
My next few posts will dig deeper to try to understand where these losses and gains occurred. We’ll start by focusing on enrollment by grade level: that is, where (in which grades) did we gain and lose students in 2020-21? And, how does this compare to enrollment trends for those grades over the last 5 years?
We’ll focus on grades with overall enrollment loss, first.
Note: For the most part, KCPS and KC Charter public schools have been operating virtually this school year, with KCPS scheduled to return to school buildings in a limited fashion in late March/early April, and several charters now back in school on a hybrid basis. To my knowledge, Genesis Charter (K-8) is the only public school within KCPS boundaries that’s been fully open, serving students inside their school building, all school year.
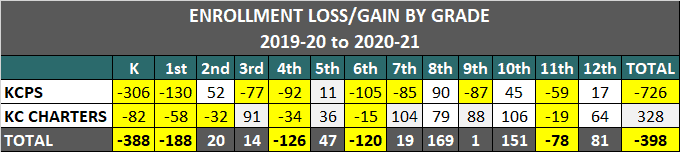
Gains and losses in 2020-21
Let’s start with a chart.
This chart summarizes enrollment gains and losses by grade, by both sector and in total. Cells highlighted in yellow are enrollment losses, compared to the 2019-20 school year.
In grades K, 1, 4, 6 and 11 both KCPS and Charters lost enrollment, with both sectors incurring the biggest grade loss in Kindergarten.
What does enrollment in these grades look like over the last five years?
Kindergarten
Kindergarten Enrollment: -388 Students
K enrollment is flat up until 2021; of all K-12 grades, it’s the most competitive between KCPS and charter schools
2021 represents a significant decrease compared to previous years for KCPS; at -306 students, Kindergarten attrition accounts for one-third of all KCPS enrollment loss in 2021
From 2018 on – for four years – there have been more K students enrolled in charters than in KCPS. (This is the Kindergarten tipping point I wrote about back in 2016)
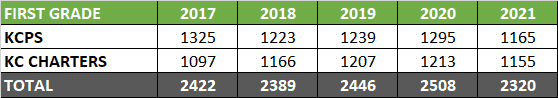
First Grade
First Grade Enrollment: -188 Students
Similar to Kindergarten, first grade enrollment is also pretty competitive between KCPS and Charters
KCPS had a steeper decline in first grade enrollment in 2021
In 2021, we’re approaching the first grade tipping point, where there are nearly as many first graders in charter schools as in KCPS
Overall, there are fewer first graders in public schools in 2021 than in 2017
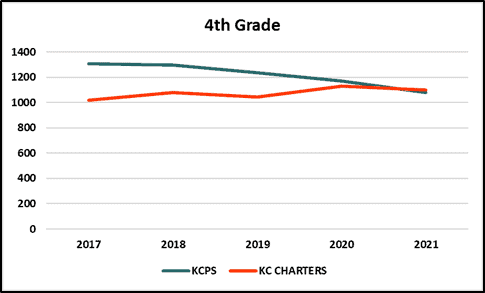
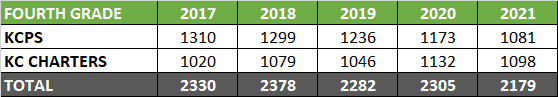
Fourth Grade
Fourth Grade Enrollment: -126 Students
There are fewer 4th graders in our public schools in 2021 than there were in 2017
4th grade KCPS enrollment has been declining since 2017, it’s grown slightly, overall, in the charter sector
In 2021, we hit the 4th grade tipping point, with more 4th grade students in charter public schools than in KCPS schools
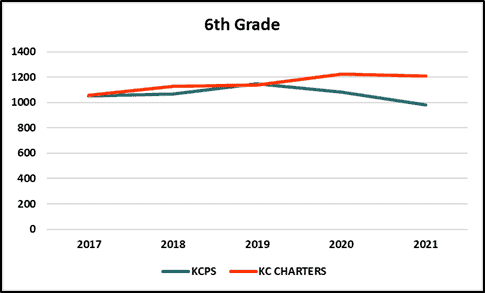
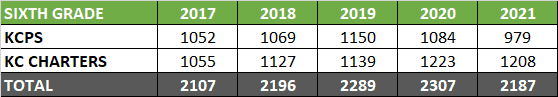
Sixth Grade
Sixth Grade Enrollment: -120 Students
Until 2019, 6th grade enrollment was more competitive between KCPS and charters, when charter enrollment began to grow, and KCPS experienced a simultaneous decline
Charter 6th grade enrollment was trending up until 2021
Overall, there are more 6th graders enrolled in public schools in 2021 than in 2017
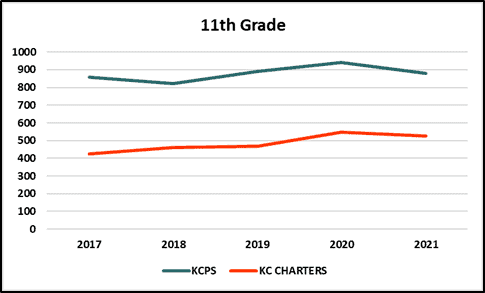
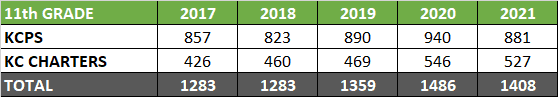
11th Grade
11th Grade Enrollment: -78 Students
Unlike grades K, 1, 4, and 6, where there’s tight competition between KCPS and Charters for student enrollment, in Grade 11 KCPS has clear market dominance – there are significantly more 11th graders in KCPS high schools than there are in charter schools
11th grade charter enrollment grew until 2021, when it declined slightly
Overall, there are more 11th grade students enrolled in 2021 than there were in 2017
A few take-aways
In 2021, we lost enrollment, overall, in five grades: K, 1, 4, 6, and 11. These are all grades in which enrollment, prior to 2021, had been steady or had slight growth (with the exception of Kindergarten, which was down 29 students overall in 2020).
In each of these grades, KCPS sustained bigger enrollment losses than did charter public schools.
The big questions: Where did these students go? Will they come back in the 2021-22 school year? And to what effect, on both student achievement and the overall system? For a good article on the impact of this year’s drop in Kindergarten enrollment on schools next year, read this recent Kansas City Star article).
That grades K and 1 enrollment are down isn’t really a surprise, as these are earlier grades where parents would be more inclined to keep their children home altogether (Kindergarten is not mandatory in the state of Missouri) or find another school with in-person learning – the burden of online learning is especially significant for families of younger students.
Because 6th grade is a transition year to middle school, parents and caregivers might feel particularly compelled to elect for a school, whether private or in another district, where school is in-person.
In 11th grade, students dropping out, or transferring to schools with in-person learning, are likely explanations. Sports could also be a consideration.
The decline in 4th grade enrollment is harder to explain.
Do you have any insights or new observations on the above grade-level analyses? Send an email, or leave a comment below.
Up next: Enrollment gains in 2021 – in which grades did we gain students, overall?
DESE recently released 2021 preliminary enrollment data for 2021. As anyone who’s read Set the Schools Free for any period of time knows, I really love K-12 enrollment data. Why? Because it tells us so much about the real choices families are making about K-12 public education within KCPS boundaries.
In “before-times” I might conduct a really comprehensive analysis of enrollment data and release it in a big post, all at once. See this, this and this.
But my new coronavirus lifestyle (read: kids home ALL THE TIME) isn’t as conducive to that kind of writing. So, just in time for the vaccine, I’ve figured out that I need a new approach.
Instead I’m going to write a series of shorter posts that answer different questions about 2020-21 enrollment, and how it compares to previous years. I’ll wrap up the series with some key take-aways.
As my oldest son would say: Let’s go!
What does K-12 enrollment in 2021 look like in our district, overall?
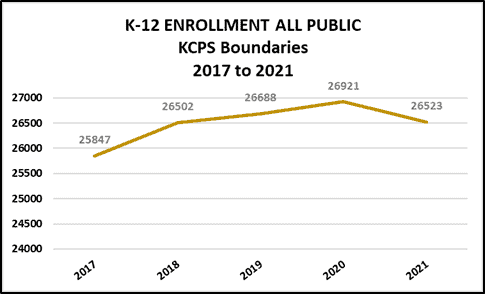
A closer look: after several years of overall growth, K-12 enrollment is down ~400 students from 2020
Because of coronavirus, public school enrollment in urban districts is down across the US.
The same holds true here in KC, though to a lesser extent: after several years of growth, overall K-12 public enrollment is down slightly from last school year, by 398 students (a 1.5% decrease).
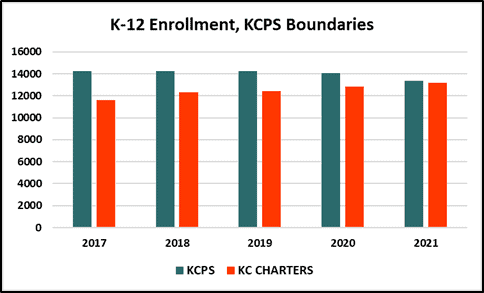
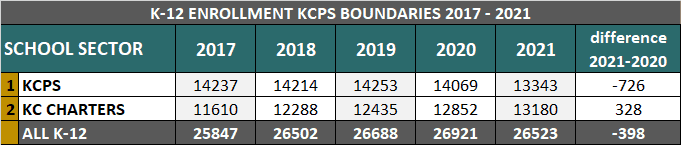
Where was the movement? In KCPS, mostly.
After several years of stable enrollment, Covid-19 brought KCPS a significant enrollment decline
A breakdown of enrollment by sector shows that KCPS enrollment declined by 726 students while charter public enrollment continued to grow, this year by 328 students (similar to previous years’ growth).
This doesn’t mean that all KCPS schools lost students, or that all charter schools gained. It also doesn’t mean that all students who left KCPS went to charters. Rather, the numbers merit closer study.
All we really know at this point is that, during a pretty extraordinary school year, our traditional public school district lost enrollment, and enrollment in independent public schools continued to grow.
Enrollment at the tipping point
Altogether, these changes have brought us to the tipping point I first wrote about in 2016 when I launched Set the Schools Free – public school enrollment within KCPS boundaries is now split nearly 50/50.
The coronavirus brings us to the tipping point
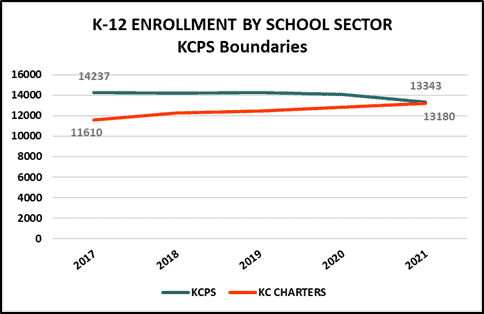
With ~32 public schools that educate 13,343 students, KCPS is still the largest operator of public schools within our district, by far; our largest charter school operator (Frontier Charter, with five schools) educates 1,621 students.
But collectively, about as many students now attend charter public schools as attend KCPS schools. This shift has important ramifications for school funding equity, enrollment practices, transportation, accountability…for just about everything, really.
But, perhaps most importantly, it’s a good prompt to start re-thinking our attitudes about public education within KCPS boundaries, overall. More on that later…
Up next: A grade-level analysis -where did we lose and gain students in 2020-21?
________________________
Do you have questions about 2021 enrollment you’d like answered? Email me at settheschoolsfree[at]gmail.com.
Equity starts with access to information. Understanding the different student populations our public schools serve is an important part of meeting the needs of all students.
More data in your stocking…
As a good friend recently wrote in their holiday card, there’s little original – or cheery – to say about events of 2020.
But there’s a lot of value in informing the conversation with good data.
With that in mind, Set the Schools Free is emerging from a long slumber to begin updating some of its most popular data tools and posts, and to add some new analyses as well.
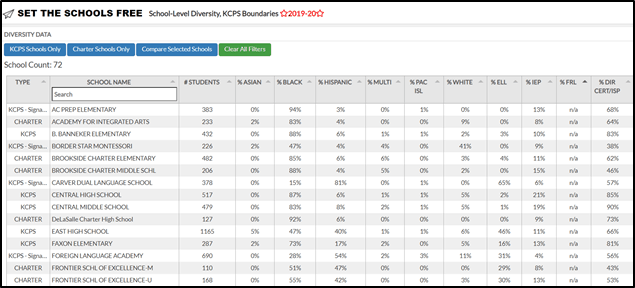
Most immediately, the School-Level Diversity Table, originally launched in December 2018, is now updated with 2019-20 student demographic data for all K-12 public schools within KCPS boundaries. This data was released by DESE at the beginning of December.
Click above to access, sort and compare 2019-20 school-level student demographic data
The Diversity Table is sortable by school type (KCPS or charter); race and ethnicity; and ELL-LEP, IEP, FRL and Direct Certification status. You can compare (and count) different schools by highlighting them and then hitting the “Compare Selected Schools” button. To start over, press “Clear all filters.”
What do our schools look like?
This tool is meant to provide an easy way to look up demographic information for a particular school, or to compare and contrast different schools – at this point it’s not a data aggregator. Here are a few interesting take-aways from the school-level vantage point.
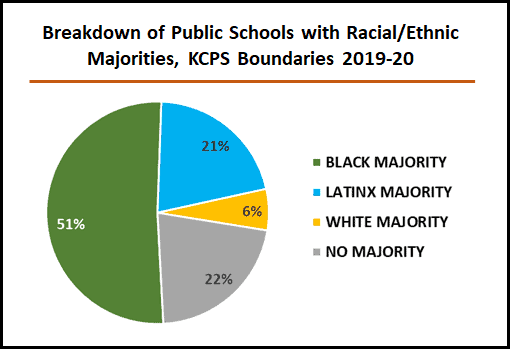
Majority = 50% or more of students at an individual school are of one race/ethnicity. Includes all KCPS and charters.
+75% of public schools within KCPS boundaries (56 of 72 schools) serve student populations with a majority (50% or more) of students of one race or ethnicity.~50% of all K-12 public schools (37 of 72) serve student populations that are majority Black/African American; ~20% (15 of 72) serve populations that are 50% or more Hispanic/LatinX; and 6% (4 of 72) serve student populations that are majority White.
~20% of all K-12 schools (15 of 72) serve student populations that are +50% English Language Learners-Limited English Proficiency (ELL-LEP). Note that not all of these schools are predominantly Hispanic (see Garfield, Whittier and Kansas City International Academy, all of whom serve significant refugee populations).
60% of schools (42 of 72) serve student populations in which 50% or more students are “directly certified” as students whose families receive SNAP, TANF, or who are unaccompanied, migrant, homeless or in foster care. For more information on direct certification as a proxy for socio-economic need, and how this compares to Free and Reduced Lunch eligibility, see this January 2019 post from Set the Schools Free.
Note that the 50% figure upon which I’m basing this analysis is somewhat arbitrary – it’s simply a useful benchmark that we can all understand. Also note that these demographic data are school-level, rather than district-level. That means, for example, that University Academy, which is a K-12 public charter “district” comprised of an elementary, middle and high school, is counted in this tally as three individual schools – each with its own demographic make-up.
What does our district look like, overall?
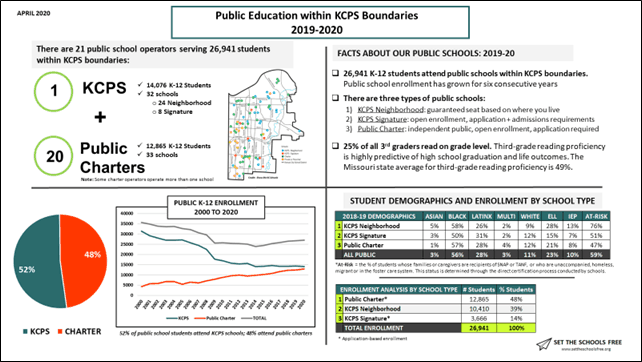
A one-page overview of public education within KCPS boundaries, 2019-20
If you’re curious about the big picture – the overall demographics of our school district, both in aggregate and broken down by school type – you can find this information, as well as other key summary data, in the Set the Schools Free2020 Public Education Overview, KCPS Boundaries. While the enrollment data is from 2019-20, the demographic data is still from 2018-19.
And what are the major demographic trends shaping our district?
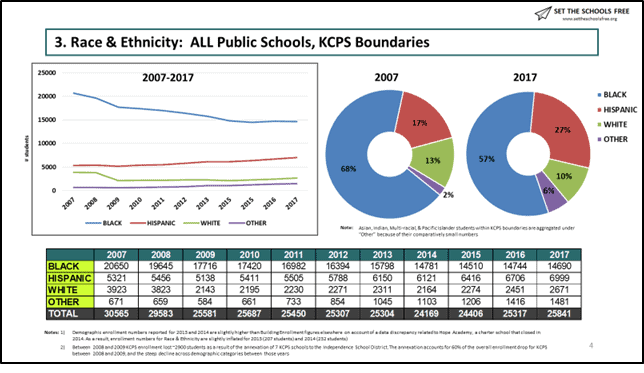
An analysis of student demographics within KCPS boundaries (KCPS + Charter), 2007 -2017
Finally, what do our schools look like, compared to our city?
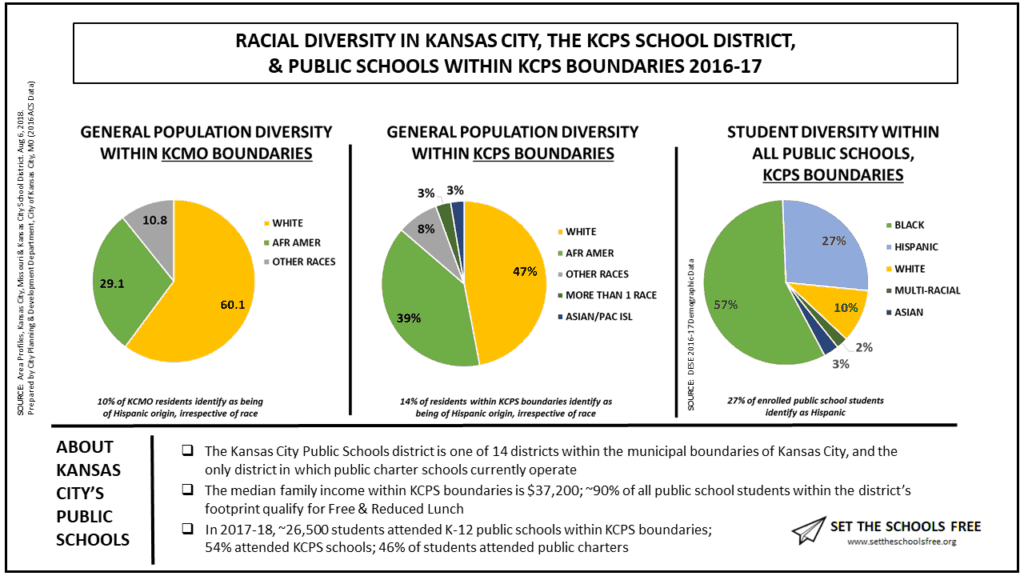
And to compare public school demographics to the demographics of both our city and school district, check out The gift of school level diversity data, KCPS boundaries. There are some useful charts in the post that are a great resource.
____________________________
Over the next few months Set the Schools Free will be updating existing analyses and, hopefully, creating a few new ones. What’s useful to you? If there’s a certain issue you’ve been thinking about, or a burning question you have that can be answered with publicly available data, let me know – I’d love to hear your suggestions.
For those of us invested in the well-being of Kansas City’s students, families, and schools, this vote provides an important opportunity to make a difference both inside and outside the classroom.
Because healthy families = healthy children. And right now, too many adults in too many families, both here within KCPS boundaries and across Missouri, lack reliable access to health care.
A vote in favor of Medicaid expansion will extend healthcare coverage for up to 300,000 low-income Missourians, of which 45,000 to 50,000 are parents who currently don’t have coverage.
So on August 4, please show up for Kansas City students and their families – vote “Yes on 2″ for Medicaid expansion in Missouri.
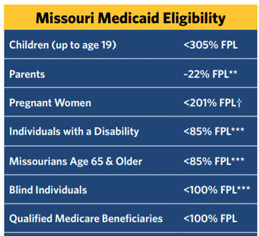
Medicaid in Missouri – a quick overview
Medicaid provides health insurance for people with low incomes, and is financed through a state-federal partnership. Nationally, one in five Americans, 20%, receives their health coverage through Medicaid. In Missouri, roughly one in six Missourians are covered by Medicaid – primarily those who don’t have employer-sponsored health insurance or are unable to afford private insurance in the individual marketplace.
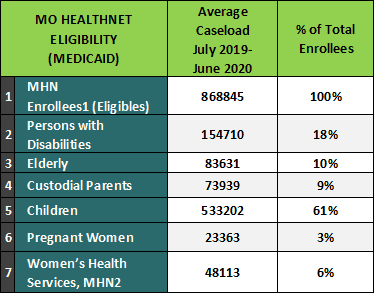
The majority of Medicaid beneficiaries are children. In Missouri, children make up 61% of all Medicaid enrollees, followed by Persons with Disabilities (18%) and the Elderly (10%).
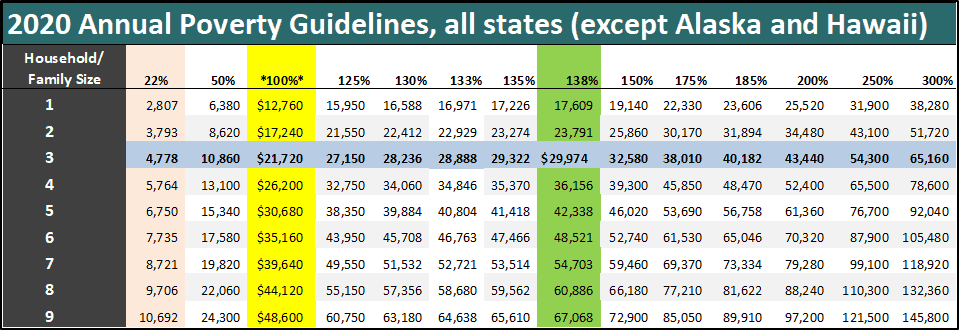
To be eligible for Medicaid as a custodial parent in Missouri, a family of three must earn less than $4,778 a year, or $400/month. That’s just 22% of the Federal Poverty Level (see below for a chart of 2020 Annual Poverty Guidelines).
And non-disabled, low-wage Missouri adults without children don’t qualify for assistance at all.
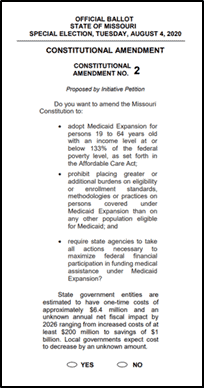
Voting “Yes on 2″ will expand access to Missouri adults aged 19-64 with an income at or below 133% of the Federal Poverty Level. (Because of the way this is calculated – yes, Medicaid is very complicated – this actually turns out to be 138% of the Federal Poverty Level).
But practically speaking this means that a custodial parent of a family of three making up to $29,974 will now be Medicaid-eligible. Non-disabled low wage adults without children will be eligible if they make up to $17,609/year.
Why does Medicaid expansion matter for KC students and public schools?
It’s probably no surprise that individuals who have access to reliable healthcare tend to be…healthier. Parents with Medicaid coverage are more likely to pursue preventive care for themselves. They’re also more likely to pursue this care, such as well-child visits and vaccinations, for their children.
And they’re less likely to experience illness that leads to chronic absenteeism, loss of wages or de-stabilizing medical debt, which can lead to increased student mobility, lower academic outcomes, and social/emotional challenges that our public schools – both traditional public and public charter – are too often expected to solve on their own.
By expanding Medicaid access for adults statewide, we have an opportunity to begin addressing these race and ethnicity-based gaps in healthcare access, improving the health of our families, students, and community as a whole.
Healthy families + healthy children = healthier schools & communities
Research shows that expansion leads to increased healthcare access and better outcomes; an increase in state savings (by offsetting state costs in other areas); and reductions in uncompensated care costs, leading to employment gains and labor market growth.
And a recent analysis published by The Commonwealth Fund concluded that “Studies that examine the fiscal impact of Medicaid expansion on specific states or the effects across all states find consistent results: expansion leads to significant budget savings and significant revenue increases (even without imposing additional taxes).”
_____________________
The past few months have shown, in stark relief, the enormous challenges we face as a country in addressing the cumulative effects of systemic racism and growing economic inequality in our communities. On so many different fronts, the challenges we face are so big, and so daunting, it’s hard to know how or where to begin in trying to make a difference.
On August 4 we have a unique opportunity to vote for a measure that will directly impact the lives of children and families, both here in Kansas City and across our state, by improving access to quality healthcare state-wide.
For our students, for our families, for our schools – show up on August 4th and Vote “Yes on 2” for Healthcare for Missouri.
For a list of organizations that support Medicaid expansion, click here.
The following post originally appeared on the Missouri Charter Public School Association website. It builds on a key theme of Set the Schools Free: the importance of bringing schools, their leaders, and their decision-making processes closer to students and the communities they serve.
____________________________
Now more than ever Missourians are expecting public schools to respond quickly to student and community needs. What can we learn from the public charter school model during covid-19?
Cities will face unprecedented challenges over the next months and years as they work to recover from the social, emotional, and economic toll wrought by the coronavirus pandemic. And nowhere will the collective, human impact of this toll be felt more acutely than in K-12 public schools.
St. Louis, Missouri
Like most US cities struggling to overcome legacies of educational, economic and racial inequality, our public schools in Kansas City and St. Louis face daunting challenges during the best of times: Poverty is concentrated. Schools are segregated. The proficiency gap between economically disadvantaged students and their more advantaged peers is large, particularly for students of color.
Now, with months of learning and emotional supports lost due to physical-distancing and school closures – and with the prospect of closures and distancing continuing into the next school year – we’re forced to consider what meeting this challenge looks like during the worst of times.
What’s clear is that, during this time of uncertainty and scarcity, we’ll be expecting our public schools to do even more.
Now more than ever we need schools that are agile, and able to respond quickly to student and community needs. And we need school leaders and teachers who are empowered to innovate and problem solve, coming up with creative ways to address the most difficult challenges schools face.
The good news? We have a blueprint
There’s a blueprint for this type of school. It’s called a public charter school. And if you live in Kansas City or St. Louis, your child, or the child of someone you know, might attend one: in Kansas City, 48% of all K-12 public school students within Kansas City Public Schools (KCPS) boundaries attend public charters; in St. Louis, 38% of students within St. Louis Public Schools (SLPS) boundaries attend a charter school. Altogether, charters educate 24,594 students in Missouri, 3% of all K-12 public students statewide.
Charter schools are publicly-funded schools that operate independently of traditional public school districts. In charter schools, decisions about a school’s most important resources – staffing, budget, time and curriculum – are made at the school-level, closest to students.
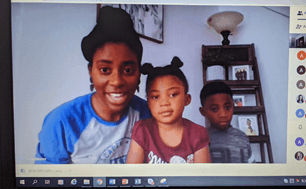
Ms. Asha Moore, Dean of Instruction at AFIA, leads a virtual “Harambe,” or community meeting, for AFIA students. Her children also attend AFIA
By bringing decision-making inside the school building, the charter school model reduces the distance between school leadership and students, making schools more agile and responsive. It builds a sense of school ownership, and facilitates the development of strong community partnerships. And it encourages innovation, and different approaches to running schools.
How Missouri charter schools are responding to covid-19
Over the past six weeks we’ve seen the advantages of this model as Missouri’s charter schools have responded to the needs of students and families with remarkable speed.
In St. Louis, North Side Community School, a K-8 charter in one of the most economically disadvantaged parts of the city, surveyed families and found that two-thirds of their 500 students lacked laptops and one-third lacked internet access. Through a community partnership, North Side quickly procured laptops and connectivity for all its students, enabling virtual school to begin for all students.
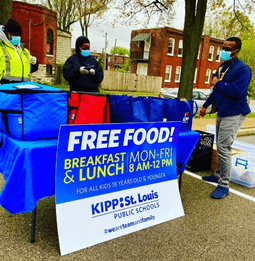
Food distribution at KIPP STL
KIPP St. Louis, a network of six charter schools serving 2,300 K-12 students, launched a weekly KIPP St. Louis Family Newsletter to provide resources and updates to families in order to keep them connected to the larger KIPP STL community during this challenging time. Each KIPP student is paired with a teacher for weekly check-ins.
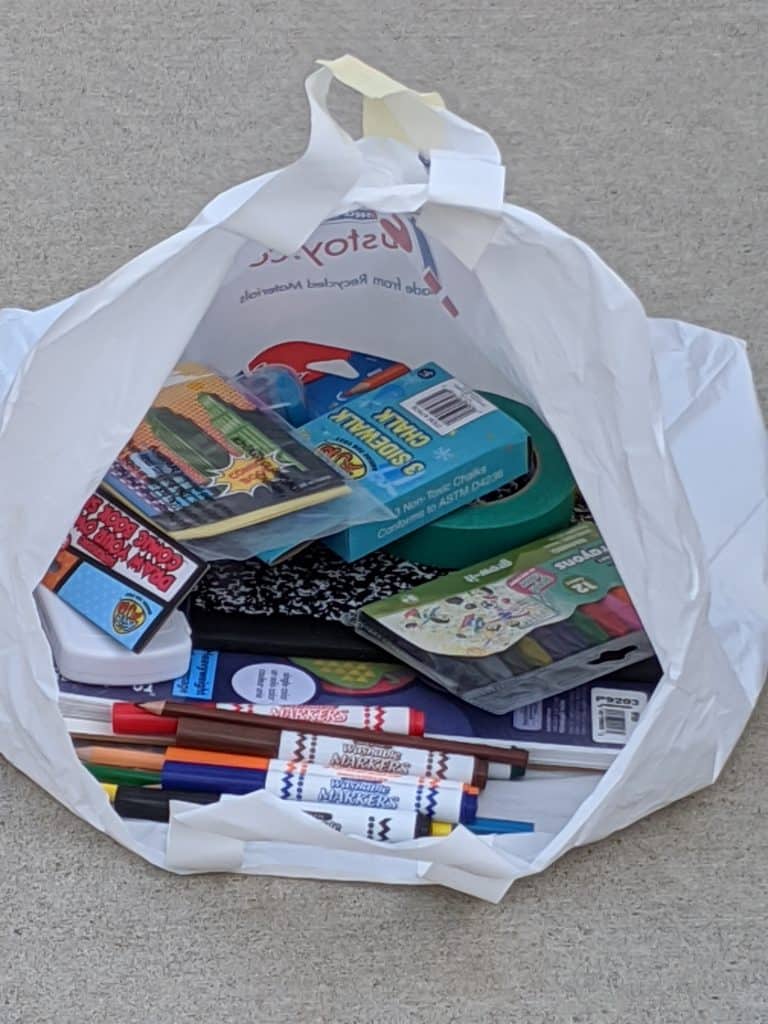
At Academy for Integrated Arts (AFIA), a K-6 arts-focused school serving 250 students in Kansas City, AFIA staff deliver food, technology, and other supports directly to the homes of students whose families lack transportation. AFIA volunteers assembled at-home art kits for each student; the arts continue to be a central focus of AFIA’s online instruction.
Art kits assembled for AFIA students
And in partnership with a local non-profit, University Academy, a K-12 Kansas City charter that serves 1,100 students, delivers fresh produce twice a week to the school’s most at-risk families, in addition to providing daily meals for its students.
These are but a few examples of how Missouri’s public charter schools, with the support of trusted community partners, are responding to the needs of their school communities while standing up and conducting virtual instruction.
And they’re doing all of this on a tighter budget: In Missouri, because of a glitch in the state’s charter school law, charters get approximately $1,100 less per student per year than traditional public schools. This means that a 300-student charter school receives approximately $330,000 less per year than an SLPS or KCPS school serving approximately the same student population. This funding inequity forces charter schools to be resourceful. But it also makes them vulnerable, especially in times of economic crisis, when every dollar counts.
The real innovation of public charters? Bringing decision-making closer to students
One of the original intentions of charters schools, when they were developed in the 1990s, was to create an environment in which innovation could be fostered in a small-school setting. Not every innovation would work, of course, but those that were successful could be adopted by traditional public school districts, who through their centralized organizational structures, could bring them to scale, reaching thousands of students.
For a variety of reasons, this vision of district-charter collaboration didn’t materialize. But, as we consider what public education looks like in the time of COVID-19, and what we’ll be expecting from schools going forward, maybe the real innovation of charter schools isn’t one particular program, or curriculum.
Maybe the real innovation is the school model itself, an adaptable model that, in this time of crisis, offers a blueprint for all public schools for how we can empower educators and bring schools, their leaders, and their decision-making processes closer to students and the communities they serve.
For the third year in a row, Set the Schools Free has put together a one-page overview of public education within KCPS boundaries.
Click on above image to enlarge or print
The purpose of this overview – and one of the broader goals of Set the Schools Free – isto make basic facts about our system of public schools more readily available. Because if we can build consensus around an objective set of facts we can have more informed and solutions-oriented conversations about the challenges facing public education within KCPS boundaries.
Note: This enrollment analysis is based on the revised 2020 preliminary enrollment figures released by DESE in February 2020. These numbers replace the preliminary data released in January 2020. You can download the revised numbers at dese.mo.gov.
____________________
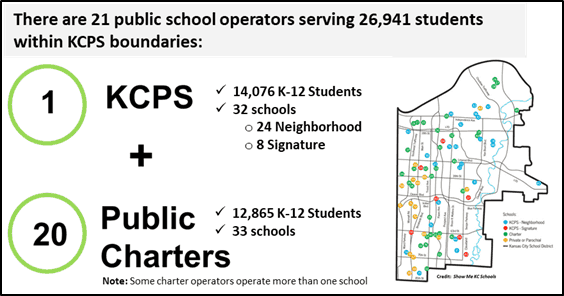
In 2019-20, there are 21 public school operators educating 26,941 K-12 students within KCPS boundaries.
KCPS remains our largest operator of public schools, with 32 schools serving 14,076 K-12 students. KCPS enrollment declined slightly between 2019 and 2020, from 14,287 to 14,076 students (-211 students). Lincoln Middle, a KCPS signature school and feeder to Lincoln College Prep High School, opened in its new building, serving 6-8th graders. Previously, the middle school was co-located in Lincoln High.
The number of public charter school operators decreased from 21 to 20. Two charter schools closed in Spring 2020: 1) Pathway Academy (academic performance); and 2) Kansas City Neighborhood Academy (low enrollment). In Fall 2020, a new charter school, the Kansas City Girls Preparatory Academy, opened with its first class of fifth-graders. It will eventually serve grades 5-12.
Collectively, Kansas City’s charter schools now serve 12,865 students. K-12 charter enrollment increased by 390 students – 3% overall – from 12,475 students in 2018-19.
Overall, K-12 public enrollment grew slightly between 2018-19 and 2019-20, from 26,762 students to 26,941 students in 2019-2020 (+179 students). Total public school enrollment has grown for six years in a row, driven by growth in charter enrollment.
Third-Grade Reading: An Academic Focal Point
I’ve included only one academic metric on this overview: third-grade reading proficiency. As I’ve written before, third-grade reading is foundational. Low-third grade literacy effectively puts a ceiling on what our schools are able to achieve academically: third-graders who can’t read in third-grade continue onto fourth grade, and then fifth, and sixth…..absent some meaningful intervention, students don’t show up the next year knowing how to read.
According to 2019-20 MAP scores, 25% of third-graders within KCPS boundaries read on grade level; the Missouri state average is 49%.
Of the 43 KCPS and charter elementary schools operating within KCPS boundaries, only five schools had third-grade reading proficiency at or above the state average. 11 of 43 schools- 1 of 4 – have 3rd-grade reading proficiency of 10% or lower.
Enrollment & Demographics by School Type
In previous years I’ve broken out K-12 enrollment by school type (KCPS Neighborhood, Signature, Public Charter) to understand the overall percentage of students attending choice-based schools. To facilitate a better understanding of the different student populations served by each type of school, this year Set the Schools Free also analyzed student demographics by school type.
For background, there are three different types of public schools within KCPS boundaries.
KCPS Neighborhood: Operated by KCPS. Guaranteed seat based on where you live
Public Charter: Operate independently of KCPS. Application-based enrollment.
Of these three school types, KCPS neighborhood schools are the only schools that don’t have application-based enrollment. Signature Schools are the most selective, withattendance, discipline and, in some cases, testing requirements. (If you’re interested in learning more about the history of signature (magnet) schools in St. Louis and Kansas City Public Schools, read this blog post from St. Louis University’s PRIME Center.)
Note: When we look at demographics by school type, it’s important to remember that there can be significant variation among and between different types of schools with respect to the students they serve; there are charter schools, for example, with student demographics similar to the highest-needs KCPS neighborhood schools. Similarly there are KCPS neighborhood schools whose demographics more closely match KCPS signature schools. If you’re interested in analyzing schools by different student demographics, the Set the Schools Freestudent-level diversity table is a useful tool.
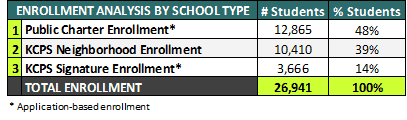
Enrollment by School Type
Within KCPS boundaries, more students attend independent public charters (12,865) than any other type of public school. There are more than three times the number of students in charter schools (12,865) as there are in KCPS signature schools (3,666).
Signature schools make up 26% of all KCPS enrollment.
When you combine charter and signature enrollment – 62% of K-12 public school students attend “schools of choice” – schools that require an application to enroll.
Demographics by School Type
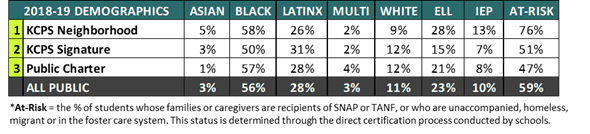
Collectively, KCPS neighborhood schools have the highest concentration of At-Risk, English Language Learners (ELL) and Special Needs students of all school types.
Compared to neighborhood schools, KCPS signature schools are, on a percentage basis, Whiter and less Black. They have a significantly lower percentage of At-Risk students (you can read more about this At-Risk classification, and its strengths and weaknesses as a proxy for student need, here; note that “At-Risk” percentages for KCPS Neighborhood and signature schools are slightly inflated because they include pre-K enrollment; for charter schools they are slightly lower). Signature schools also have a lower percentage of both ELL and IEP students than neighborhood schools.
How do signature school demographics compare to public charter schools? Both are application-based and, overall, their demographics are fairly similar – on a percentage basis public charter schools have more Black and ELL students. They have a similar percentage of IEP students; the percentage of At-Risk students in charters is slightly lower.
But it’s important to understand some of the other differences between these two types of schools. Similar to signature schools, enrollment in charters is capped – once enrollment targets are met, students are put on waiting lists.
Unlike signature schools, charter schools aren’t selective enrollment – for example, there are no “test-in” charter schools (Lincoln College Prep Middle and High School are two KCPS signature schools with testing requirements). Nor do charter schools have discipline and attendance requirements. But, similar to signature schools, there are a few charter schools that, because of their curricular programs, don’t backfill after particular grades – Academie Lafayette, a French Immersion school, doesn’t backfill after 1st grade unless students have French language proficiency; the Kauffman School, a college prep charter, doesn’t backfill in the upper grades).
Although charter schools, unlike KCPS schools, aren’t required by law to provide student transportation, 85% of all charter schools provide transportation. The only schools that don’t provide transportation are: Brookside Charter, Citizens of the World, DeLaSalle, and Scuola Vita Nuova.
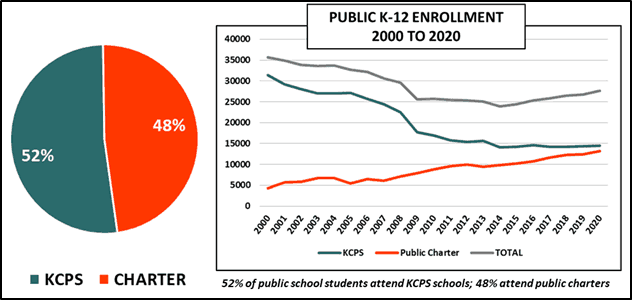
Enrollment Trends Over Time
This enrollment graph, which shows enrollment broken down by school sector over the last 20 years, shows how our public education landscape has changed over time. It was also the first graph I used when I launched Set the Schools Free in March 2016.
Key take-away, both then and now: public education within KCPS boundaries continues to change!
Enrollment in independent public charter schools has grown steadily since 2000, while enrollment in KCPS schools has, overall, declined.
Enrollment in public charter schools has grown steadily since 2000, and KCPS enrollment has declined. We’ll soon approach the tipping point, where there will be more students in public charters than in the KCPS system overall – and more students will attend public charters than any other type of public school.
This shift away from traditional neighborhood-based enrollment toward independent, autonomous public schools requires us to re-think the systems and structures that support public education in KC, from how we apply to schools, to how our schools our funded, to how we hold them accountable. Future posts will explore these topics in more depth.


