DESE recently released 2021 preliminary enrollment data for 2021. As anyone who’s read Set the Schools Free for any period of time knows, I really love K-12 enrollment data. Why? Because it tells us so much about the real choices families are making about K-12 public education within KCPS boundaries.
In “before-times” I might conduct a really comprehensive analysis of enrollment data and release it in a big post, all at once. See this, this and this.
But my new coronavirus lifestyle (read: kids home ALL THE TIME) isn’t as conducive to that kind of writing. So, just in time for the vaccine, I’ve figured out that I need a new approach.
Instead I’m going to write a series of shorter posts that answer different questions about 2020-21 enrollment, and how it compares to previous years. I’ll wrap up the series with some key take-aways.
As my oldest son would say: Let’s go!
What does K-12 enrollment in 2021 look like in our district, overall?
Because of coronavirus, public school enrollment in urban districts is down across the US.
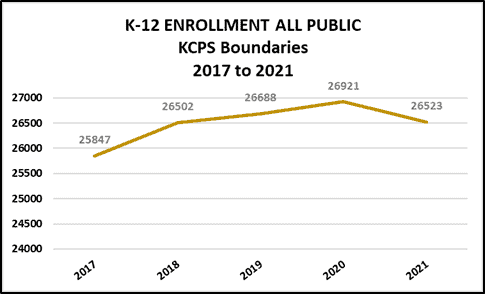
The same holds true here in KC, though to a lesser extent: after several years of growth, overall K-12 public enrollment is down slightly from last school year, by 398 students (a 1.5% decrease).
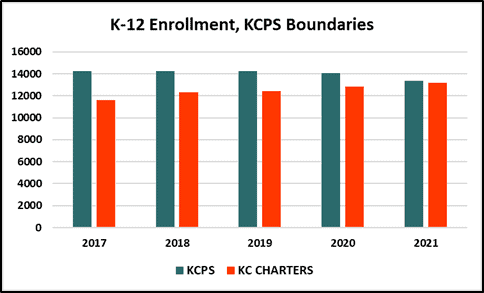
Where was the movement? In KCPS, mostly.
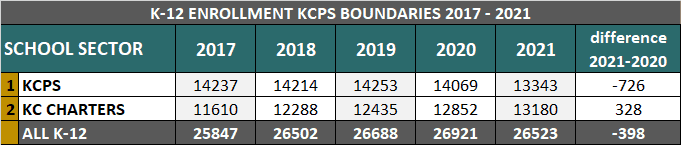
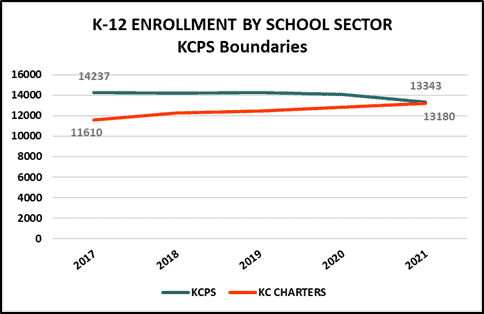
A breakdown of enrollment by sector shows that KCPS enrollment declined by 726 students while charter public enrollment continued to grow, this year by 328 students (similar to previous years’ growth).
This doesn’t mean that all KCPS schools lost students, or that all charter schools gained. It also doesn’t mean that all students who left KCPS went to charters. Rather, the numbers merit closer study.
All we really know at this point is that, during a pretty extraordinary school year, our traditional public school district lost enrollment, and enrollment in independent public schools continued to grow.
Enrollment at the tipping point
Altogether, these changes have brought us to the tipping point I first wrote about in 2016 when I launched Set the Schools Free – public school enrollment within KCPS boundaries is now split nearly 50/50.
With ~32 public schools that educate 13,343 students, KCPS is still the largest operator of public schools within our district, by far; our largest charter school operator (Frontier Charter, with five schools) educates 1,621 students.

But collectively, about as many students now attend charter public schools as attend KCPS schools. This shift has important ramifications for school funding equity, enrollment practices, transportation, accountability…for just about everything, really.
But, perhaps most importantly, it’s a good prompt to start re-thinking our attitudes about public education within KCPS boundaries, overall. More on that later…
Up next: A grade-level analysis -where did we lose and gain students in 2020-21?
________________________
Do you have questions about 2021 enrollment you’d like answered? Email me at settheschoolsfree[at]gmail.com.
