This holiday season Set the Schools Free brings you some handy reference documents on school-level diversity within our district boundaries, plus a dynamic table to help you sort through the numbers yourself.
One of my core beliefs in writing Set the Schools Free is that building consensus around an objective set of facts will allow us to have more productive, solutions-oriented conversations about the challenges facing our public schools.

Earlier this Fall I participated in a Midwest convening of the Diverse Charter Schools Coalition, a national coalition of schools that have racially, culturally, and socioeconomically diverse student populations. DCSC helps create diverse public charters through research, advocacy and outreach. Citizens of the World Kansas City is a DCSC member.
In preparation for the gathering I put together an overview of student diversity in Kansas City’s charter school sector to share with participants. The document was useful, so I wanted to share the overview – which now includes KCPS schools, and is taken from publicly available data from DESE – with you. As we talk about race, equity, and diversity across our school district, I think we all benefit from more access to accurate school-level information.
Happy Holidays!
To learn more about the demographic trends in our public schools over the last decade see my earlier posts on Student Demographics within KCPS Boundaries. In summary, African American enrollment has declined significantly; enrollment of Hispanic, Multi-Racial and White students is growing; overall public school enrollment has grown for the last four years. Most of this enrollment growth is occurring in our charter sector.
What does diversity look like in our city?
And how does it compare to our public schools? The slide below compares race and ethnicity of the general population of Kansas City as a whole to the general population of our school district – and then to our population of public school students. The general population data are from the 2012-2016 American Community Survey, which I retrieved from the very useful “Area Profiles” of Kansas City and the Kansas City School District, compiled by KCMO’s City Planning and Development Department.
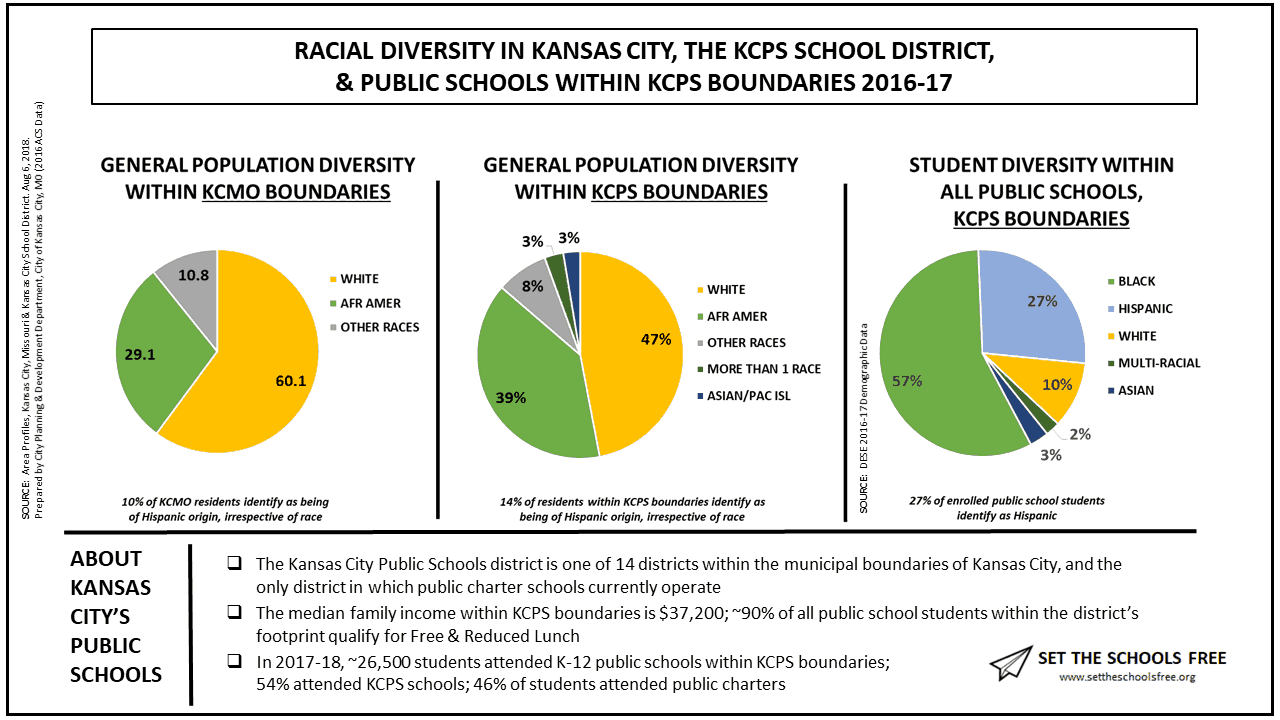
The pie charts show pretty clearly that our public schools don’t reflect the make-up of either our district population overall, or of our larger city. The representation of African-American and Hispanic students in our public schools is disproportionate to the general population. White residents make up the biggest population group within our city, and within the footprint of our school district – but, as of 2016-17, only 10% of all public school students within KCPS boundaries.
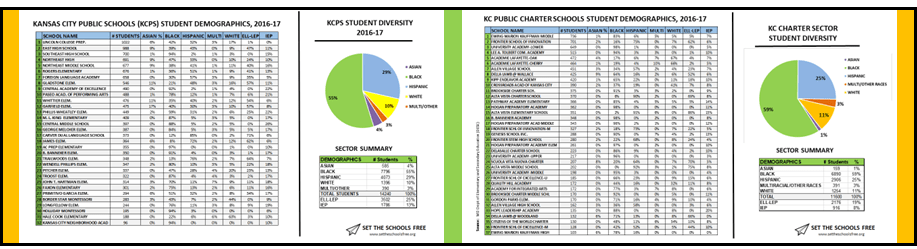
What does diversity look like in our schools?
These slides provide school-level demographic data (race/ethnicity + ELL and IEP data) for 2016-17, the last year for which it’s available. The first are KCPS schools, sorted by size. The second are charter schools, again sorted by size. These are meant to be general reference documents.
It’s hard to understand patterns or trends, though, without the ability to manipulate the data.
A tool to help you make sense of it all
Set the Schools Free has developed a simple tool that allows you to sort demographic data at the school level. This dynamic table allows you to look at all public schools together, or isolate just KCPS or charter schools. Then you can sort schools by any one of the columns. You can also compare different schools to one another by clicking on individual schools and then “compare.”
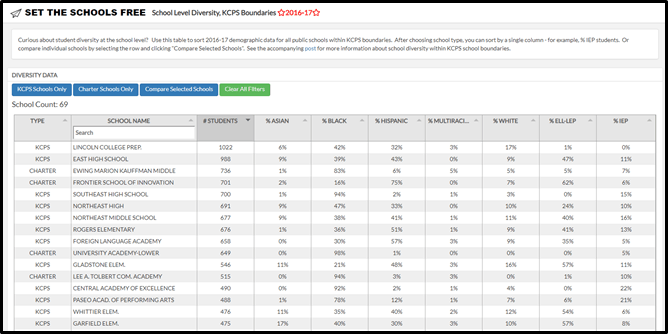
In a district in which the majority of students are African American and Hispanic, the majority of our schools – 55 of 69, or almost 80% — are predominantly African American or Hispanic. Most schools in our district serve at least some white students, though white students are most heavily concentrated in a handful of schools of choice – mostly charter schools. On a percentage basis, the schools serving the highest percentage of White, Hispanic, African American and ELL students tend to be charters. KCPS neighborhood schools serve a higher percentage of IEP students.
One of my biggest take-aways from sorting through the data was that some of my assumptions about school-level diversity in our district were simply wrong; a number of our schools are more diverse than I realized. I thought this was encouraging.
I’m curious to hear what you see when you look at the data. What do you find most surprising? Email me or leave a comment below, I’d love to hear from you.
______________________________________
Note: Because of the Community Eligibility Provision (CEP), a program in which schools with a high percentage of students eligible for Free & Reduced Lunch (FRL) can forgo the paperwork and extend free lunch to their entire student population, most public schools in our district are no longer collecting or reporting FRL data. Socioeconomic status is obviously a really important part of school diversity; I hope to be able to include this information within the coming months.

Rebecca!
This is a great tool! Is it possible for you to include a breakdown of demographic data for teachers at the school level? I’m wondering how the teacher diversity (at the school level) compares to the student diversity ( at the school level)? If possible, including a gender breakdown at the school level (teacher and student) would be helpful as well. Thank you for creating a forum for allowing data to drive fruitful conversations about education in Kansas City .
Thanks again for providing the early Christmas data gift!
Best,
Cokethea Hill
Cokethea, thanks for this feedback – I’m glad you find the data useful. Including teacher diversity at the school level is a great idea, and one I hadn’t thought of. I think that including that information would be really valuable for everyone. Thanks for this suggestion!