Equity starts with access to information. Understanding the different student populations our public schools serve is an important part of meeting the needs of all students.

As a good friend recently wrote in their holiday card, there’s little original – or cheery – to say about events of 2020.
But there’s a lot of value in informing the conversation with good data.
With that in mind, Set the Schools Free is emerging from a long slumber to begin updating some of its most popular data tools and posts, and to add some new analyses as well.
Most immediately, the School-Level Diversity Table, originally launched in December 2018, is now updated with 2019-20 student demographic data for all K-12 public schools within KCPS boundaries. This data was released by DESE at the beginning of December.
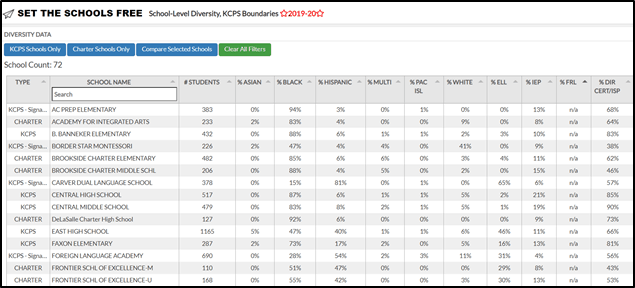
The Diversity Table is sortable by school type (KCPS or charter); race and ethnicity; and ELL-LEP, IEP, FRL and Direct Certification status. You can compare (and count) different schools by highlighting them and then hitting the “Compare Selected Schools” button. To start over, press “Clear all filters.”
What do our schools look like?
This tool is meant to provide an easy way to look up demographic information for a particular school, or to compare and contrast different schools – at this point it’s not a data aggregator. Here are a few interesting take-aways from the school-level vantage point.
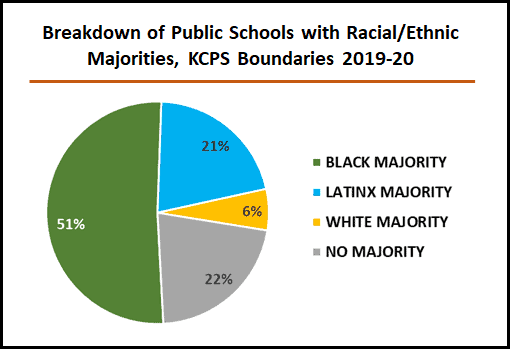
- +75% of public schools within KCPS boundaries (56 of 72 schools) serve student populations with a majority (50% or more) of students of one race or ethnicity. ~50% of all K-12 public schools (37 of 72) serve student populations that are majority Black/African American; ~20% (15 of 72) serve populations that are 50% or more Hispanic/LatinX; and 6% (4 of 72) serve student populations that are majority White.
- ~20% of all K-12 schools (15 of 72) serve student populations that are +50% English Language Learners-Limited English Proficiency (ELL-LEP). Note that not all of these schools are predominantly Hispanic (see Garfield, Whittier and Kansas City International Academy, all of whom serve significant refugee populations).
- 60% of schools (42 of 72) serve student populations in which 50% or more students are “directly certified” as students whose families receive SNAP, TANF, or who are unaccompanied, migrant, homeless or in foster care. For more information on direct certification as a proxy for socio-economic need, and how this compares to Free and Reduced Lunch eligibility, see this January 2019 post from Set the Schools Free.
Note that the 50% figure upon which I’m basing this analysis is somewhat arbitrary – it’s simply a useful benchmark that we can all understand. Also note that these demographic data are school-level, rather than district-level. That means, for example, that University Academy, which is a K-12 public charter “district” comprised of an elementary, middle and high school, is counted in this tally as three individual schools – each with its own demographic make-up.
What does our district look like, overall?
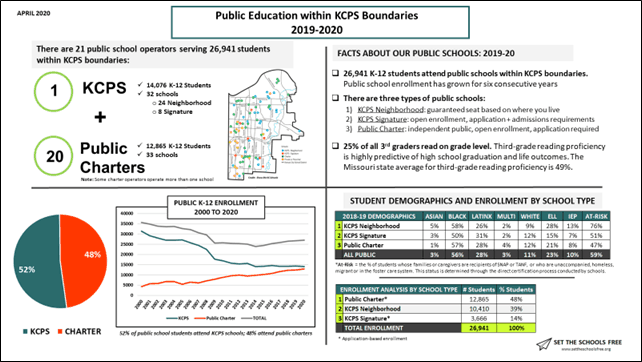
If you’re curious about the big picture – the overall demographics of our school district, both in aggregate and broken down by school type – you can find this information, as well as other key summary data, in the Set the Schools Free 2020 Public Education Overview, KCPS Boundaries. While the enrollment data is from 2019-20, the demographic data is still from 2018-19.
And what are the major demographic trends shaping our district?
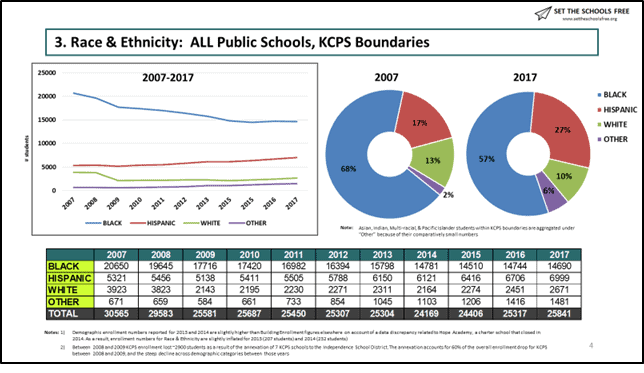
If you want to know about the major demographic trends shaping our student population, check out Student demographics within KCPS Boundaries – Part I: The data and Student demographics within KCPS boundaries – Part II: An analysis. This two-part Set the Schools Free analysis from March 2018 covers a ten-year period from 2006-07 to the 2016-17 school year and includes demographic trends broken out by both traditional public and public charter enrollment.

For an in-depth analysis of Kansas City teacher demographics over time, see Teacher demographics in Kansas City Part I: Understanding the Representation Gap and Teacher demographics in Kansas City Part II: 2000-2018. This analysis also includes demographic trends broken out by both traditional public and public charter schools.
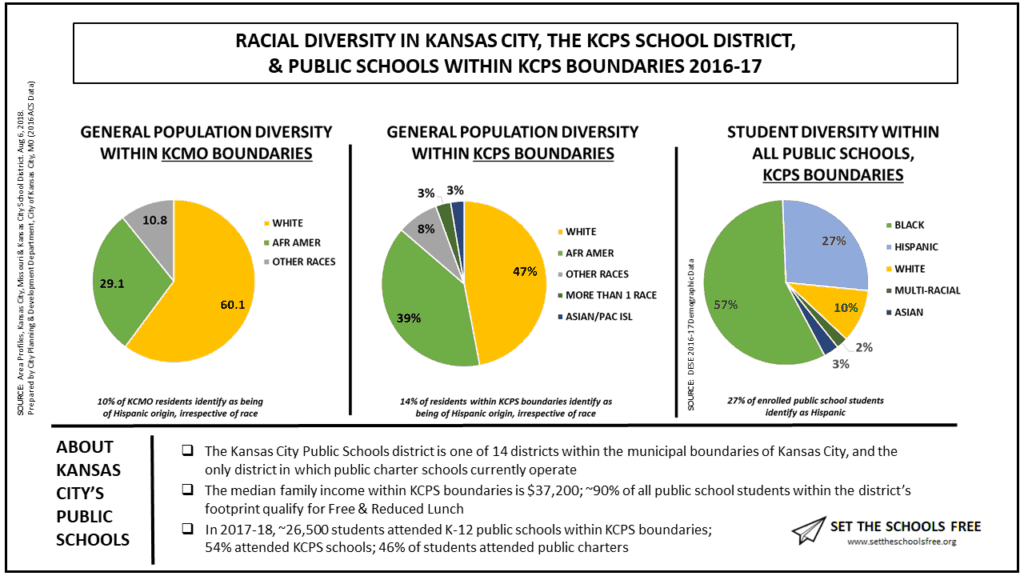
Finally, what do our schools look like, compared to our city?
And to compare public school demographics to the demographics of both our city and school district, check out The gift of school level diversity data, KCPS boundaries. There are some useful charts in the post that are a great resource.
____________________________
Over the next few months Set the Schools Free will be updating existing analyses and, hopefully, creating a few new ones. What’s useful to you? If there’s a certain issue you’ve been thinking about, or a burning question you have that can be answered with publicly available data, let me know – I’d love to hear your suggestions.
