Key facts, at your fingertips.
__________________________
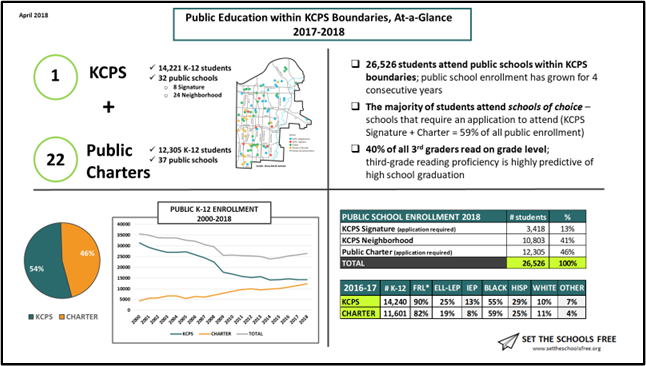
For the 5th year in a row, Set the Schools Free is publishing a one-page overview of K-12 public education within KCPS boundaries.
This, my friends, is no small task!
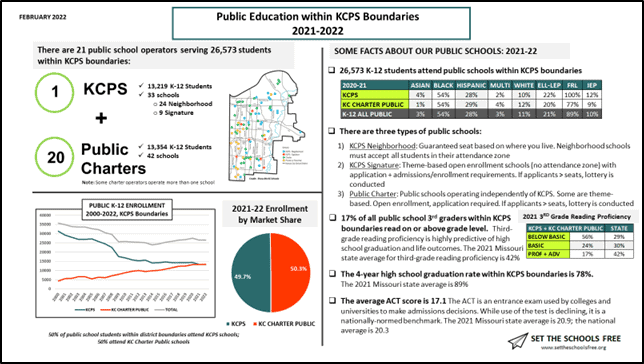
Drawing from multiple DESE data sets (and involving numerous failed attempts at creating decent-looking graphics) this 2021-22 overview includes basic information about the number of public school operators within KCPS boundaries (21); the number of K-12 students served (26,573 altogether, broken out by school sector) as well as student demographic and third-grade reading data.
And this year, for the first time, the overview includes the 4-year average HS graduation rate (78%) and ACT average (17.3), both benchmarked against the state.
Finally, the overview includes enrollment trend data from 2000 to this current 2021-22 school year. The year 2000 (the 1999-2000 academic year) is the first year charter public schools began operating in Kansas City, so it’s a good starting point to evaluate how the advent of independent public schools has changed our public education landscape over the past two decades.
Included below are links to summaries from previous years, going back to 2017-18. Each of the overviews are a bit different, including different information – so it’s worth taking a look through the years!
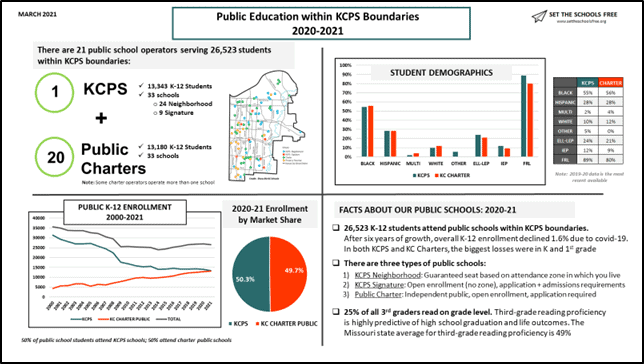
2020-21 K-12 Overview, KCPS Boundaries
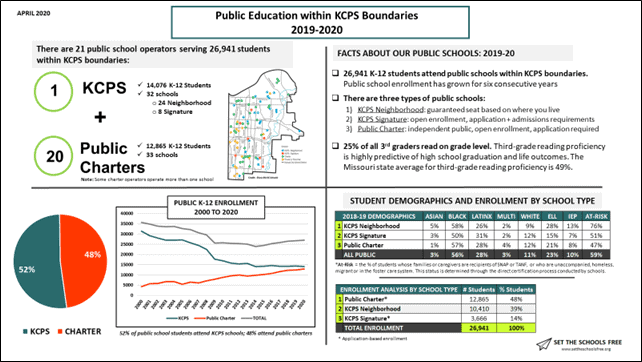
2019-20 K-12 Overview, KCPS Boundaries
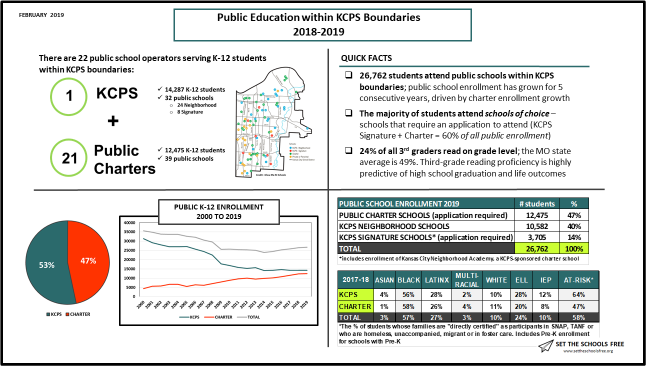
2018-19 K-12 Overview, KCPS Boundaries
2017-18 K-12 Overview, KCPS Boundaries
Questions/comments? Feel free to email me at Set the Schools Free.
