For the third year in a row, Set the Schools Free has put together a one-page overview of public education within KCPS boundaries.
The purpose of this overview – and one of the broader goals of Set the Schools Free – is to make basic facts about our system of public schools more readily available. Because if we can build consensus around an objective set of facts we can have more informed and solutions-oriented conversations about the challenges facing public education within KCPS boundaries.
To see last year’s overview, click here.
2020 by the Numbers
Note: This enrollment analysis is based on the revised 2020 preliminary enrollment figures released by DESE in February 2020. These numbers replace the preliminary data released in January 2020. You can download the revised numbers at dese.mo.gov.
____________________
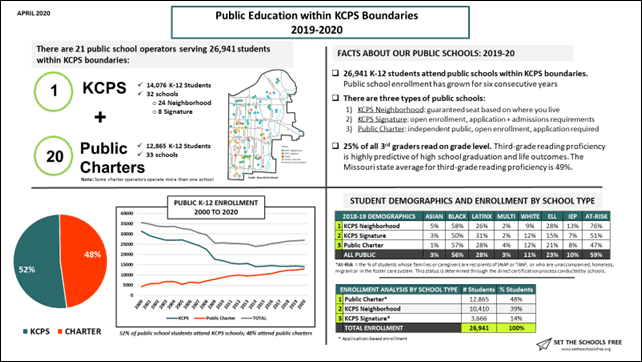
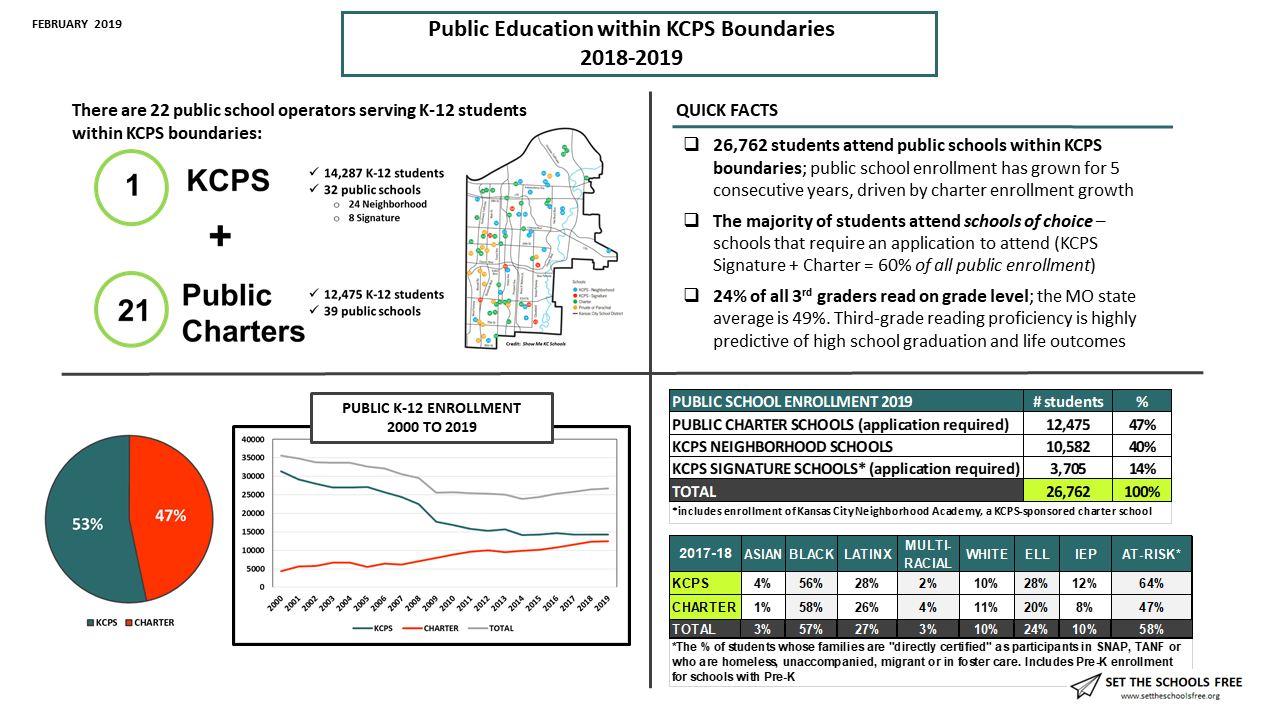
In 2019-20, there are 21 public school operators educating 26,941 K-12 students within KCPS boundaries.
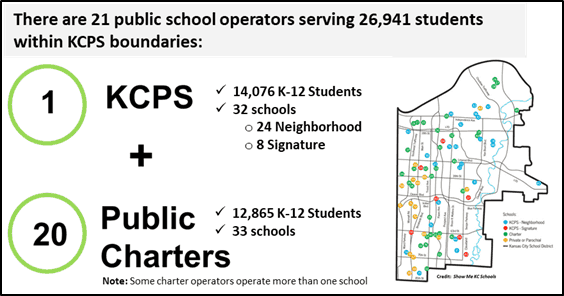
KCPS remains our largest operator of public schools, with 32 schools serving 14,076 K-12 students. KCPS enrollment declined slightly between 2019 and 2020, from 14,287 to 14,076 students (-211 students). Lincoln Middle, a KCPS signature school and feeder to Lincoln College Prep High School, opened in its new building, serving 6-8th graders. Previously, the middle school was co-located in Lincoln High.
The number of public charter school operators decreased from 21 to 20. Two charter schools closed in Spring 2020: 1) Pathway Academy (academic performance); and 2) Kansas City Neighborhood Academy (low enrollment). In Fall 2020, a new charter school, the Kansas City Girls Preparatory Academy, opened with its first class of fifth-graders. It will eventually serve grades 5-12.
Collectively, Kansas City’s charter schools now serve 12,865 students. K-12 charter enrollment increased by 390 students – 3% overall – from 12,475 students in 2018-19.
Overall, K-12 public enrollment grew slightly between 2018-19 and 2019-20, from 26,762 students to 26,941 students in 2019-2020 (+179 students). Total public school enrollment has grown for six years in a row, driven by growth in charter enrollment.
Third-Grade Reading: An Academic Focal Point
I’ve included only one academic metric on this overview: third-grade reading proficiency. As I’ve written before, third-grade reading is foundational. Low-third grade literacy effectively puts a ceiling on what our schools are able to achieve academically: third-graders who can’t read in third-grade continue onto fourth grade, and then fifth, and sixth…..absent some meaningful intervention, students don’t show up the next year knowing how to read.
According to 2019-20 MAP scores, 25% of third-graders within KCPS boundaries read on grade level; the Missouri state average is 49%.
Of the 43 KCPS and charter elementary schools operating within KCPS boundaries, only five schools had third-grade reading proficiency at or above the state average. 11 of 43 schools- 1 of 4 – have 3rd-grade reading proficiency of 10% or lower.
Enrollment & Demographics by School Type
In previous years I’ve broken out K-12 enrollment by school type (KCPS Neighborhood, Signature, Public Charter) to understand the overall percentage of students attending choice-based schools. To facilitate a better understanding of the different student populations served by each type of school, this year Set the Schools Free also analyzed student demographics by school type.
For background, there are three different types of public schools within KCPS boundaries.
- KCPS Neighborhood: Operated by KCPS. Guaranteed seat based on where you live
- KCPS Signature: Operated by KCPS. Application-based enrollment + admissions requirements. Theme-based.
- Public Charter: Operate independently of KCPS. Application-based enrollment.
Of these three school types, KCPS neighborhood schools are the only schools that don’t have application-based enrollment. Signature Schools are the most selective, with attendance, discipline and, in some cases, testing requirements. (If you’re interested in learning more about the history of signature (magnet) schools in St. Louis and Kansas City Public Schools, read this blog post from St. Louis University’s PRIME Center.)
Note: When we look at demographics by school type, it’s important to remember that there can be significant variation among and between different types of schools with respect to the students they serve; there are charter schools, for example, with student demographics similar to the highest-needs KCPS neighborhood schools. Similarly there are KCPS neighborhood schools whose demographics more closely match KCPS signature schools. If you’re interested in analyzing schools by different student demographics, the Set the Schools Free student-level diversity table is a useful tool.
Enrollment by School Type
Within KCPS boundaries, more students attend independent public charters (12,865) than any other type of public school. There are more than three times the number of students in charter schools (12,865) as there are in KCPS signature schools (3,666).
Signature schools make up 26% of all KCPS enrollment.
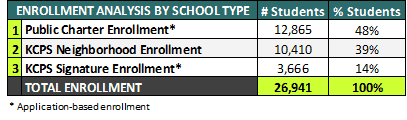
When you combine charter and signature enrollment – 62% of K-12 public school students attend “schools of choice” – schools that require an application to enroll.
Demographics by School Type
Collectively, KCPS neighborhood schools have the highest concentration of At-Risk, English Language Learners (ELL) and Special Needs students of all school types.
Compared to neighborhood schools, KCPS signature schools are, on a percentage basis, Whiter and less Black. They have a significantly lower percentage of At-Risk students (you can read more about this At-Risk classification, and its strengths and weaknesses as a proxy for student need, here; note that “At-Risk” percentages for KCPS Neighborhood and signature schools are slightly inflated because they include pre-K enrollment; for charter schools they are slightly lower). Signature schools also have a lower percentage of both ELL and IEP students than neighborhood schools.
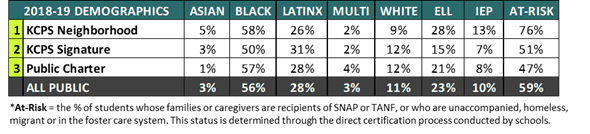
How do signature school demographics compare to public charter schools? Both are application-based and, overall, their demographics are fairly similar – on a percentage basis public charter schools have more Black and ELL students. They have a similar percentage of IEP students; the percentage of At-Risk students in charters is slightly lower.
But it’s important to understand some of the other differences between these two types of schools. Similar to signature schools, enrollment in charters is capped – once enrollment targets are met, students are put on waiting lists.
Unlike signature schools, charter schools aren’t selective enrollment – for example, there are no “test-in” charter schools (Lincoln College Prep Middle and High School are two KCPS signature schools with testing requirements). Nor do charter schools have discipline and attendance requirements. But, similar to signature schools, there are a few charter schools that, because of their curricular programs, don’t backfill after particular grades – Academie Lafayette, a French Immersion school, doesn’t backfill after 1st grade unless students have French language proficiency; the Kauffman School, a college prep charter, doesn’t backfill in the upper grades).
Although charter schools, unlike KCPS schools, aren’t required by law to provide student transportation, 85% of all charter schools provide transportation. The only schools that don’t provide transportation are: Brookside Charter, Citizens of the World, DeLaSalle, and Scuola Vita Nuova.
Enrollment Trends Over Time
This enrollment graph, which shows enrollment broken down by school sector over the last 20 years, shows how our public education landscape has changed over time. It was also the first graph I used when I launched Set the Schools Free in March 2016.
Key take-away, both then and now: public education within KCPS boundaries continues to change!
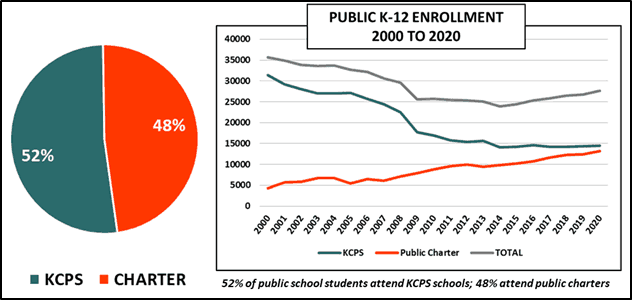
Enrollment in public charter schools has grown steadily since 2000, and KCPS enrollment has declined. We’ll soon approach the tipping point, where there will be more students in public charters than in the KCPS system overall – and more students will attend public charters than any other type of public school.
This shift away from traditional neighborhood-based enrollment toward independent, autonomous public schools requires us to re-think the systems and structures that support public education in KC, from how we apply to schools, to how our schools our funded, to how we hold them accountable. Future posts will explore these topics in more depth.
