There’s a lot happening right now in our public high school sector. Set the Schools Free is excited to announce the launch of its KC Public High School Enrollment Dashboard to help inform the conversation.
Where are our public high schools located? How many students attend them, and from what zip codes? What does income disparity look like across our community – and how is it reflected in our public high schools?
Set the Schools Free has developed an interactive mapping tool to help answer these questions.
The Kansas City Public High School Enrollment Dashboard combines 1) 2016-2017 high school enrollment data for public high schools within KCPS boundaries, with 2) student zip code and 3) US Census median family income data to paint a more comprehensive picture of our public high school landscape.
Together, these data can help foster a better understanding of Kansas City’s public high schools and the student populations they’re serving.
How it Works
The dashboard is a (desktop) discovery tool. For example, maybe you want to better understand the enrollment profile of a specific school or set of schools.
Or you’re curious about the charter/KCPS breakout at the high school level, and from which zip codes the different sectors draw their student populations.
Perhaps you want to know which schools are serving students in a particular zipcode, how many students attend public school in that zipcode – and what the median family income in that zipcode is.
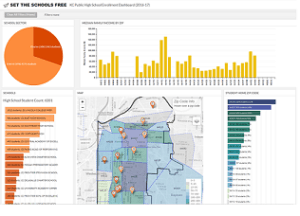
The dashboard allows you to filter on enrollment data by school sector, school(s) and zip code(s) to better understand these relationships.
- By School Sector. Click on the pie chart to see the size of each sector, a list of schools in each sector, the number of students served, student zipcodes, and the median incomes of those zip codes.
- By School(s). Click on an individual school to see how many students attend that school, the zip codes in which they live, and the median family income for that zipcode.
- By Zip Code(s). Click on a zip code to see median family income, how many students attend public schools in that zip code, and which schools they attend.
You can track the information you’re filtering on in the top left-hand corner of the dashboard. Want to start over? Click on the “clear all” button and it will bring you back to the landing page, and a high level view of our high school landscape.
AN IMPORTANT NOTE: Because this enrollment data set is organized at the building level, enrollment numbers for three KCPS high schools – Lincoln, Southeast High, and Paseo – currently include middle school enrollment figures in addition to grades 9-12. For example, HS enrollment for Lincoln College Prep is 675 students. With grades 6-8 included this number jumps to 1022.
As a result, the dashboard inflates enrollment for these KCPS high schools, and for public high schools overall, by about 10 percent (521 students).
Because these enrollment numbers are tied to actual student zip codes, it’s important to leave the data intact if we want to understand the relationship between schools and the students they serve. I hope to receive updated data from DESE soon.
Click here for precise 2016-17 HS enrollment figures by school.
____________________
For the best user experience, please view the dashboard on a desktop browser.
Please share this tool with others you think may find it of interest!
