Public school enrollment grew for the 4th year in a row in 2017-18 and kindergarten enrollment reached the tipping point – for the first time there are more kindergarten students in Kansas City charters than in KCPS schools
DESE recently posted preliminary enrollment data for the current 2017-2018 school year. I’ve put together a 2017-18 Public School Enrollment Analysis for KCPS Boundaries to help us all better understand what these data mean for our school district.
The big take-aways? 1) Overall public K-12 enrollment is growing, which is great news; 2) enrollment continues to shift toward our charter sector, whose growth outpaces KCPS – for the first time in our school district, we have more kindergarten students in charter schools than in our traditional public schools. And, 3) six of 10 students attend public schools (KCPS signature or charter) that require an application to attend.
The continued enrollment shift toward charters has important policy implications (more on that in my next post) but also has program implications for non-profits that engage with our schools. For example, if you’re running any type of school-based K-12 program, it’s important to know where the students are – you can no longer assume that because you’re partnering with KCPS you’ll automatically be reaching the majority of students in our district. Developing a better understanding of enrollment trends, then, can help you build a better program.
Here are some key data points from this year’s enrollment data that I think are worth noting:
I. OVERALL PUBLIC K-12 ENROLLMENT
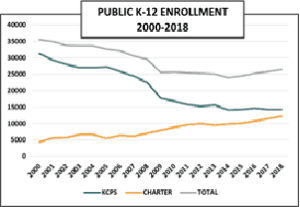
- Overall public school enrollment is up, from 25,839 to 26,526 students. This is the 4th year in a row that public enrollment has grown, after hitting an all-time low in 2013-2014
- 46% of all K-12 public school students now attend public charter schools. Charter enrollment grew 6%, from 11,599 students to 12,305 students this year
- KCPS K-12 enrollment held flat/decreased slightly from 14,240 in 2017 to 14,221 this year
II. KINDERGARTEN ENROLLMENT
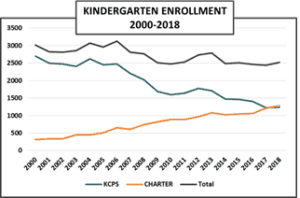
- More than half of all kindergarten students now attend public charter schools. For the first time, charter schools serve the majority (51%) of kindergarten students in our district
- Overall public kindergarten enrollment is up this year. This is the first time kindergarten enrollment has grown since 2014-2015
- Both KCPS and charter kindergarten enrollment grew in 2017-18. KCPS grew by 14 students; charters grew by 67 students
III. ENROLLMENT BY GRADE SEGMENT: K-5, 6-8, 9-12
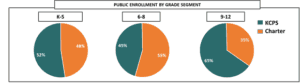
- The K-5 market is approaching the tipping point: charters now serve 48% of all K-5 students. K-5 charter enrollment has grown by 23% over the last 5 years; KCPS K-5 enrollment decreased by 4% over the same period
- The majority of 6-8th grade students in our district attend charter schools
- KCPS market share in high school decreased slightly from last year to this year due to charter school growth in grades 9-12
IV. ENROLLMENT BY SCHOOL TYPE: KCPS Neighborhood, Signature & Public Charter
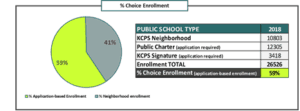
- 6 of 10 public school students attend schools that require an application to attend (KCPS signature or charter); 4 of 10 public school students attend non-application based KCPS neighborhood schools
- Of KCPS students, 1 in 4 attends a signature school; 3 of 4 students attend neighborhood schools
For a more in-depth look at these numbers and more, take a look at the 2017-18 Enrollment Analysis, KCPS Boundaries.
In my next post I’ll be writing more specifically about the policy implications of our shifting public education landscape.
To that end, I’d like to know – what are some of your concerns as charter schools are on track to serve more students than our traditional public school system? What are we potentially losing – and/or gaining? Leave a comment, I’d love to hear from you.
You can find the Preliminary 2018 Building Enrollment Data on DESE’s website here.

Rebecca, hi! These numbers are fascinating. Thanks for putting this together in a format that is so easily consumable. Wondering, is there an opportunity to look at the enrollment data disaggregated by race/class/ELL populations? Just wondering if there are trends within subgroups that will allow us to bring equity into the conversation. Thanks!
Halley, thanks for your comment and suggestion. I agree that understanding demographic trends in our district is critical for bringing equity into the conversation. One of the next projects I’m working on is an enrollment analysis broken down by demographics. Stay tuned!