I recently posted Student demographics within KCPS boundaries – Part I: The data, a summary of the demographic data for all public school students, KCPS + Charter, from 2007 to 2017. There are a lot of numbers, and it can be hard to make sense of what’s actually happening. This post will help you sort it all out.
____________________
THE BIG PICTURE. Our public school student population (KCPS + charter schools) is smaller than it was in 2007, and it’s changing: the number of Hispanic and multi-racial students is growing; the number of black students is decreasing.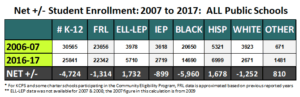
Poverty in our schools is more concentrated: although we have fewer total students who are eligible for Free & Reduced Lunch than we did a decade ago, these students today make up a higher percentage of our overall student population. We have more students who are English Language Learners or have Limited English Proficiency (ELL-LEP). The percentage of students with Individualized Education Plans (IEPs/Special Education) remained about the same, though the number of students with IEPs decreased overall. (Note: to see the data on which this analysis is based, click here.)
Here’s a more in-depth analysis that includes breakdowns by sector:
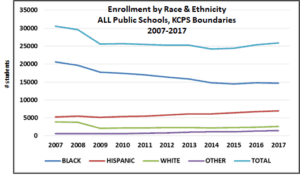
- Overall school enrollment is down 15% from 2007 – but starting to rebound. You’ve heard this here before, but it’s worth repeating: After hitting a low in 2014, overall enrollment has slowly begun to rebound – if you include 2017-2018 data, we’ve had four consecutive years of growth in public school enrollment. KCPS enrollment, though not growing consistently, has steadied in the past few years.
- Hispanic students are the fastest growing demographic in our district.
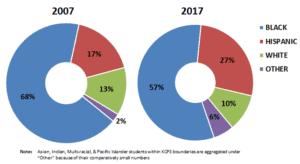 Enrollment of Hispanic students increased by nearly one-third over the last ten years; more than a quarter of all students in our district today – 27% – are Hispanic. The charter sector is capturing most of this growth: Hispanic student enrollment in charter schools increased nearly five-fold, from 591 to 2,920 students.
 - Enrollment of white students is down overall – but starting to grow. KCPS lost almost half of its white students (~1600 students) in the span of just one year with the 2008 annexation of 7 KCPS schools to Independence School District. Consequently – and despite growth in the charter sector – there are fewer white students in our district today than 10 years ago. Since 2014-15, white enrollment has grown in both sectors; in 2017, there were almost as many white students in charter schools (1271) as there were in KCPS schools (1400).
- Enrollment of multi-racial, Asian, Indian and Pacific Islander students is growing. Because of their comparatively small numbers, these students are grouped together as “Other”. Since 2007 the number of students identifying as one of these groups has more than doubled, both in KCPS and the charter sector. Growth in enrollment of students who identify as multi-racial accounts for most of this increase (Note: “Multi-racial” became an option for reporting race/ethnicity for the first time in 2011, which probably accounts for some of this increase – and a corresponding decrease in other categories).

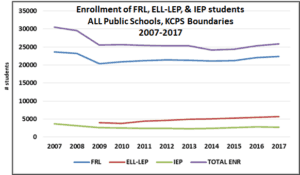
- Poverty, as measured by student eligibility for Free & Reduced Lunch status, has become more concentrated. Our student population is smaller, but their needs have increased. The number of students eligible for Free & Reduced Lunch comprises a higher percentage of our student population today than in 2007, both in KCPS and charter schools.
- The number of ELL-LEP students is growing. Between 2007 and 2017 the number of ELL-LEP students grew from 3,978 to 5,710 students; one of every five students in our public schools is an English Language Learner or has Limited English Proficiency (in KCPS it’s one of every four students). Most of this growth occurred in the charter sector: the number of ELL students in charter schools more than doubled – from 922 students in 2009 to 2,184 students in 2017.
- The overall percentage of IEP students in public schools remained flat. While the number of IEP students declined overall, the overall percentage of IEP students in our district stayed about the same.
 The number of students with IEPs in charter schools more than doubled – from 415 students to 921. The number of IEP students in KCPS schools declined by more than 40%, from 3,203 students in 2007 to 1,798 in 2017.
___________________
It’s not really a surprise that, across the board, the biggest growth in most demographic categories is in the charter sector; for most of the past decade, KCPS has been losing enrollment. KCPS, on the whole, continues to serve more students with FRL, ELL-LEP, and IEP status, both on a percentage basis and in absolute numbers, than our charter schools.
What is surprising, however, is the extent to which one demographic group – black students – is driving the changes within our district:
The decrease in black enrollment represents the largest demographic shift in our district over the last decade.
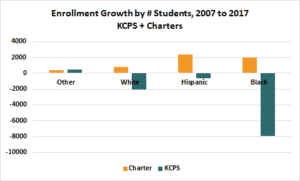
Over the last 10 years more black students have left our public schools than any other demographic. Black student enrollment in KCPS dropped by 50% in the last decade, from 15,743 students in 2007 to 7,796 students in 2017. Although black enrollment in charter schools grew (by 1,987 students) we still had a net loss of 5,960 black students, district-wide.
If you look at US Census Data from 1980 to 2014 compiled by the City’s Planning Department, you can see that the black population within KCPS boundaries has been declining for the past few decades (the only groups whose overall numbers are growing, according to the Census, are Hispanic and multi-racial families).
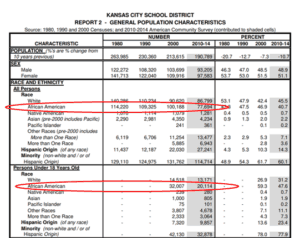
But the 50% rate at which KCPS black student enrollment has declined exceeds the rate of decrease for both the black population in general (-22%) and black children under 18 years of age (-37%) between the years of 2000 and 2010/14. (Note: the time periods I’m comparing don’t overlap completely, but are meant to provide a general benchmark/point of reference).
A few closing thoughts
This demographic analysis is big picture. It tells us, in the broadest possible terms, what our student population looks like and how it’s changed over the past decade.
It doesn’t tell us anything about what our student population looks like at the individual school level: how segregated – or diverse – our schools are, and how that’s changed over time. And it doesn’t tell us why black students, or students with IEPs, are leaving our school district.
In short, it leads to a lot of questions that merit further exploration and consideration.
But knowing the facts – that is, who’s actually attending our public schools, both KCPS and charter, and what their needs are – is a good place to start the conversation.
____________________________________
If you have any interesting insights or observations based on the data, please share them! Leave your comment or question in the comments section below.

Thanks Rebecca!
It looks like there is a big dip from 2008 to 2009 in several categories. Do we know what happened that year to have a large impact on enrollment?
Carrie, thanks for reading. And good eyes! KCPS lost 4,800 students between 2008 and 2009. The annexation of 7 KCPS schools to Independence accounts for about 3,000 of those students. Half were white (1557 students); the remaining students were Black (706 students) and Hispanic (745). But I’m not sure what other event, if any, accounts for the remaining 1,800 students who left during that year – the majority were black, which you can see reflected pretty clearly in the trendlines. And I don’t think it was just charters, because enrollment of black students in charter schools only increased by 552 students in 2009. I’ll look into this; in the meantime, if any other readers know if there was a particular event that led to the loss of 1,800 additional KCPS students between 2008 and 2009, please chime in. It’s worth noting that enrollment also declined by a similar amount (1,784 students) between 2007 and 2008.