By making public education data accessible and meaningful, Set the Schools Free is helping build a culture of information, inquiry and accountability in Kansas City’s public education sector. Promoting greater transparency around school enrollment data is an important part of building this culture.
The KC Public School Enrollment Dashboard now includes 2018-19 enrollment data for all public schools within KCPS boundaries. It also includes updated median income data from the American Community Survey for all zip codes.
With three full years of zip-code based enrollment data, the dashboard is getting more and more useful. (You can toggle between years using the blue buttons in the top right corner). Keep reading and you’ll find an interesting profile of 64130 I put together, using the dashboard. You’ll also find a handy chart and accompanying map that lays out enrollment growth and loss over the last three years, by zip!
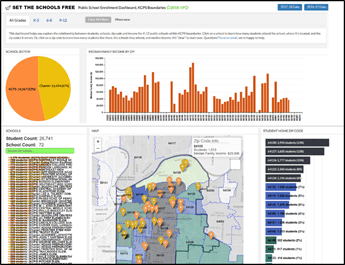
For those who aren’t familiar with the dashboard, it’s a great reference tool to understand the full universe of public schools operating within KCPS boundaries; the breakout of KCPS and charter enrollment, overall, between grade segments, and by zip; and median income across our district.
Most simply, clicking on an individual school (or group of schools) enables you to see where that school is located; the number of students it serves, and from what zip codes; and the median income of those zip codes.
Or, you can click on a zip code to understand how many students live in that zip, the schools that students in that zip code attend, and the overall KCPS-charter break-out.
Here’s an example of what I learned about 64130, the KCPS zip code with the most public school students, by clicking through the dashboard:
3,954 of 26,741 total students -14% of all public school students within KCPS boundaries – reside in the 64130 zip code, which has a median income of $37,4146 (to put this in context, a family of 4 earning less than $47,435 is eligible for reduced-price lunches, and less than $32,630 is free-lunch eligible).
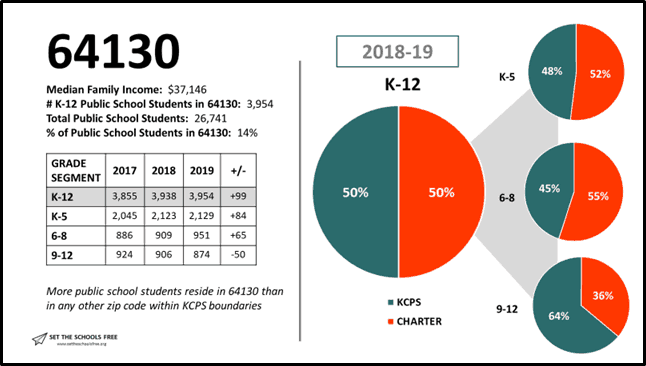
In grades K-5 and 6-8, a majority of 64130 students attend public charters. In high school, a majority of students attend KCPS schools. Overall, half of all students residing in 64130 attend KCPS schools.
Public school enrollment across the district has grown by 891 students since 2016-17, so I was also curious to see where that growth was coming from: which zip codes were adding students?
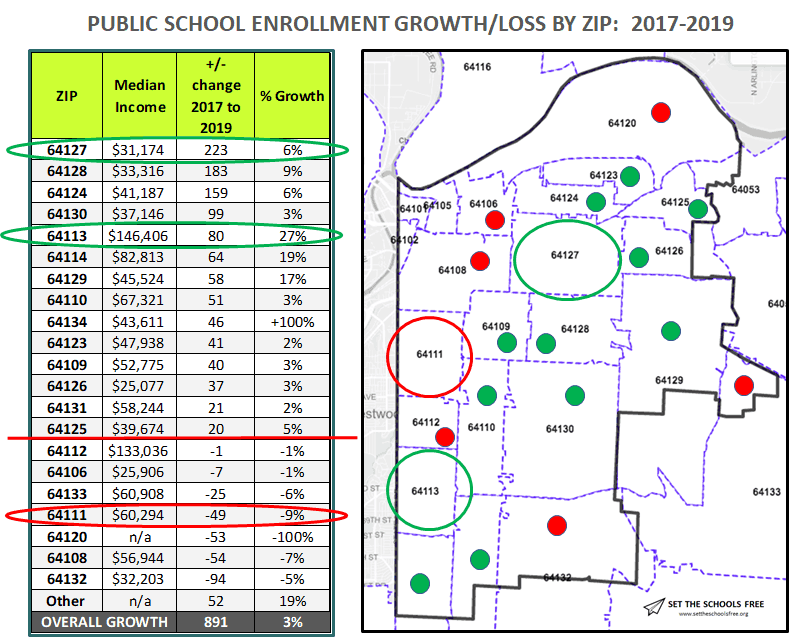
By comparing enrollment data by zip across the last three years (I copied and pasted the zip data from each year on the dashboard, then re-arranged it to facilitate analysis) I learned that 64127 (median income: $31,174), was the fastest growing zip code in terms of student enrollment. From 2017 to 2019, 64127 enrollment grew by 223 students (6%).
On a percentage basis, 64113 (median income: $146,406), grew the most, with the addition of 80 students (27%).
And 64132 (median income: $32,203) had the biggest net loss of students. 64132 enrollment shrank by 94 students, or by -5% overall.
The main point? You can use this dashboard in a number of ways to answer questions you might have. Which zip codes have the highest concentrations of KCPS students? Or the most K-5 students? Or, where do middle school students in a particular zip end up going to high school? Just click “clear all filters” to begin a new inquiry.
I’d love to hear what you’re most curious about, and what questions you’re trying to answer. Feel free to leave a comment, or send me an email.
________________
Finally, you’ll notice a few differences between this year and last year’s enrollment data. The number of students enrolled grew (again!) and the overall school count (72) is higher than last year’s (69). Here’s why:
- Benjamin Banneker Charter Academy closed at the end of 2018, so is not included in 2018-19 data
- Academie Lafayette (AL) added a new building at Armour Blvd. AL grades 6-8 are now at Armour; the AL Cherry and Oak Campuses are now both K-5 schools (previously they were split Grades K-3 and 4-8)
- Allen Village Charter School now shows up as four individual schools (it previously showed up as a K-8 and a 9-12). These are: Allen Village Primary (K-2), Elementary (3-5), Junior (6-8), and High School (9-12).
- Finally, Lincoln College Academy Middle School (KCPS) now shows up as its own school – grades 6-8 were previously bundled with Lincoln Prep High School
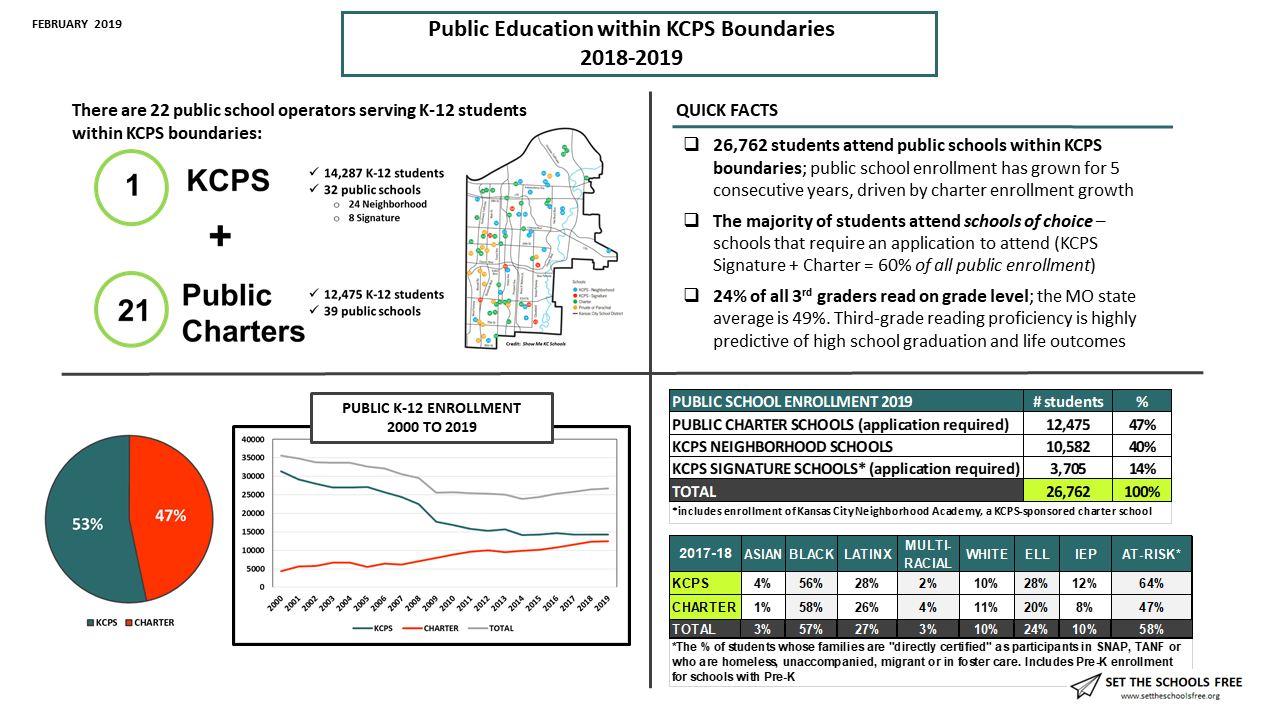
If you’re looking for a quick and easy-to-understand overview of our district, this Set the Schools Free one-page summary is still your best resource.

The Mayor should give you the key to the City. Wonderful work.
Thanks for your kind words, Woody! I’m glad you find the dashboard and analysis useful.
Ditto, Woody. Great data; how to use them to improve student performance?
Bill, thanks for this nudge. You’re right, the real conversation isn’t about enrollment growth in our district – it’s about school quality, and improving academic and life outcomes for all students in our district. My work is turning more in this direction; hopefully you’ll read more about this in future posts on Set the Schools Free. Thanks for reading!