What does Kansas City’s high school landscape look like? How many public high schools are there? How many students do they serve? And what’s the KCPS/charter breakdown?
Welcome back to Set the Schools Free. There’s been a lot of activity in our public high school sector recently:
- Southwest Early College Campus, a KCPS signature school, closed its doors in May 2016
- Southeast High School re-opened in August 2016 for students from the AC Prep signature program and surrounding neighborhoods
- Crossroads High School, the third school in the Crossroads Charter Network, welcomed its first class of 9th graders in August 2017
- The Kauffman School, a grades 5-12 college prep charter school, grew to serve grades 9 and 10, and will serve grades 9-12 by August 2018
- Academie Lafayette, a K-8 French language immersion charter school, is pursuing plans to open an International Baccalaureate (IB) high school
- Kansas City Girls Preparatory Academy, a grades 6-12 charter school, plans to open in Fall 2019 with its first sixth grade class
- The Uniting at Southwest initiative is pursuing a project-based public high school, in partnership with KCPS, at Southwest High School
With so much going on I’ve wanted to write something on high school for a while now – but was unsure where to begin.
So I decided to start with the facts. I wanted to know: What does our high school landscape look like? How many public high schools are there? How many students do they serve? And what’s the KCPS/charter breakdown in the high school market?
I’ve put together a brief landscape analysis to help answer these questions. (Access this analysis by clicking on the graphic or link above). In summary:
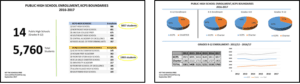
- School/student count. There are 14 public high schools (6 district, 8 charter) serving 5760 students within KCPS boundaries.
- School size. KCPS high schools are significantly bigger than charter high schools. The median size of a KCPS high school is 667 students – three times the size of the median charter high school (220 students). The biggest high school is East High School, a KCPS school, which last year served 986 students. The smallest was Allen Village (162 students). (Note, the Kauffman School served only 9 & 10th graders in 2016/17, so wasn’t included in this comparison).
- Market Share. Charter market share in the high school sector is smaller than in the overall K-12 market. 33% of all HS students (1903 students) attend charters; the remaining 66% (3857 students) attend KCPS high schools.
- Sector Growth. Overall, our public high school enrollment is growing slightly, driven by existing charter school growth. As noted earlier, there are several new charter high school initiatives currently in the works.
______________________________________
This first-level analysis of high school enrollment data answered some of my big questions. I also wanted to know: Where are schools located? Who’s attending public high school in our district? What zip codes do most students live in? And what does income disparity look like across our community – and in our schools?
Coming soon: The Kansas City Public High School Enrollment Dashboard
I’m excited to share that Set the Schools Free will soon be launching an interactive mapping tool to help answer these questions.
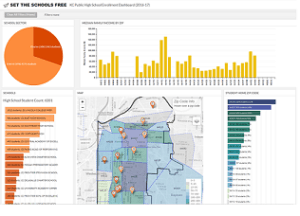
The Kansas City Public High School Enrollment Dashboard brings together 2016-2017 high school enrollment data for public high schools within KCPS boundaries with student zip code and US Census median family income data to paint a more comprehensive picture of our public high school landscape.
The main function of the dashboard is discovery. For example, maybe you want to better understand the enrollment profile of a specific school. Or you’re curious about the charter/district breakout in high school, and from which zipcodes the different sectors draw their student populations. Perhaps you want to know which schools are serving students in a particular zipcode – or how many students attend public school in that zipcode.
With the dashboard you’ll be able to filter on enrollment data by school sector, school(s) and zip code(s) to better understand these relationships.
Together, these data can help foster a better understanding of Kansas City’s high school landscape, and the students and communities they serve.
So stay tuned – the enrollment dashboard is coming soon!
A couple of notes:
1) Neither the landscape analysis nor enrollment dashboard currently address school performance. School quality is obviously a huge part of the high school conversation in Kansas City. If you’d like to know more about school performance and quality seats in our district, the IFF Kansas City Quality Schools mapping tool is a great resource. You can find it here.
2) If you’re a parent and are actively looking for high school options for your child, Show Me KC Schools is a great resource for helping locate and compare the range of school options (public and private) within KCPS school boundaries. In addition to providing up-to-date information on individual schools, they also conduct school tours and other events to connect parents and school communities. Check them out!

Super great information. My brain thinks like yours and I’ve wondered the same things. I love the graphics for Charter vs. Public schools. Very interesting.
Looking forward to the dashboard!
Thanks, Linda – I appreciate the feedback!
Great info and great on-going effort. Thank you.
Beth Salomo Haney, SW ‘75
Beth, thank you for reading my blog. I appreciate your comment.