Using growth as a focal point, the CREDO Kansas City Study helps bring clarity to an otherwise confusing school quality landscape.
Test scores for the 2018-19 school year will be released soon. They’ll tell us how well Missouri public school students performed on the state assessment (the MO Assessment Program, or MAP) in absolute terms – what percentage of students at each school score proficient or advanced in English, Math, Science and Social Studies in a given year.
What MAP scores won’t tell us, though, is how our schools compare to one another when taking into account the unique student population of each school – race, poverty, gender, language or special ed status.
Nor will they tell us how much students grew academically from one year to the next – or what that growth looks like, by sector and over time, across our district.
That’s why the CREDO Kansas City Study, released over the summer, is important. But it’s biggest value is in the big picture – not the details.
The CREDO KC study and what it tells us
The Kansas City Study is one of several “City Studies” conducted over the last year by CREDO, an education research organization at Stanford University. The goal of these studies is to provide periodic reports of academic performance in select US cities. The metric CREDO uses to communicate this performance is student growth.
The Kansas City study:
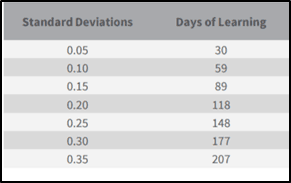
- Compares average academic growth of Kansas City students to the state average (Summary: there’s not a significant difference).
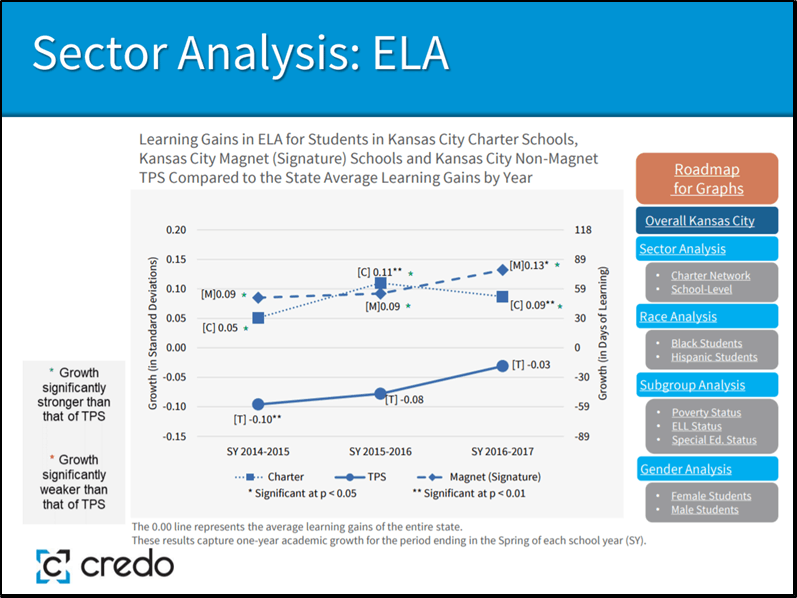
- Compares average student growth by school sector – Traditional Public, Signature, Charter – compared to the state average (Summary: In English Language Arts (ELA), charter sector growth beats both the state average and Traditional Public Schools (KCPS neighborhood). In most years, these differences are significant. Traditional Public Schools nearly close their significant negative gap with the state over this three-year period. Signature schools, most of which are selective, have similar growth to charters, but this difference is only significant with the state in one year. In Math, overall, sector differences were less significant).
- Looks at one year of growth and breaks it out by sector and subgroup, including race, poverty status, English Language Learner status, special education status and gender (Summary: As a sector, Kansas City black charter school students, special ed charter school students, and charter school students living in poverty grew significantly more in ELA, on average, than their state or traditional public school counterparts. There was no significant difference for charter LatinX students or English Language Learners).
In conducting all these comparisons, CREDO uses student-level data and controls for demographics by comparing the average growth of KC students to the growth of similar students across the state.
The CREDO City Studies were funded by Arnold Ventures. You can read CREDO’s Summary of Findings for Kansas City here. You can find a technical description of the study here.
But the real value is in the big picture
Sector averages are useful – but they can mask significant variations in performance between schools.
That’s why the real value of the CREDO KC study is in the big picture – looking at school performance in both ELA and Math according to just one variable: student growth.
TAKING A LOOK AT ENGLISH LANGUAGE ARTS
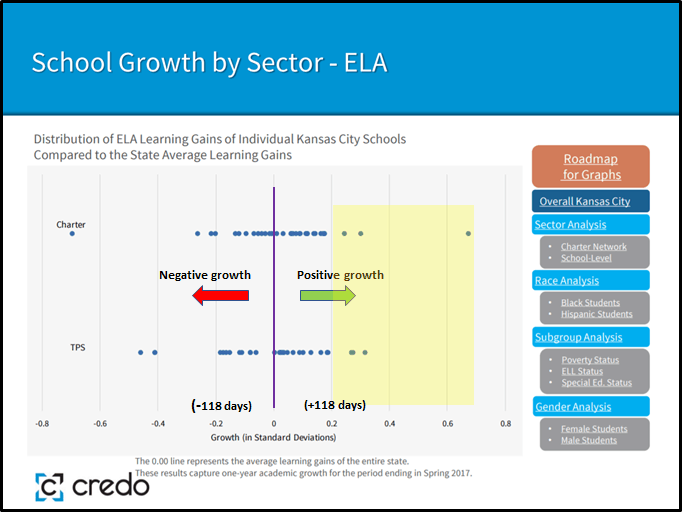
Here’s what school performance looks like in ELA for the 2016-17 school year, broken out by sector:
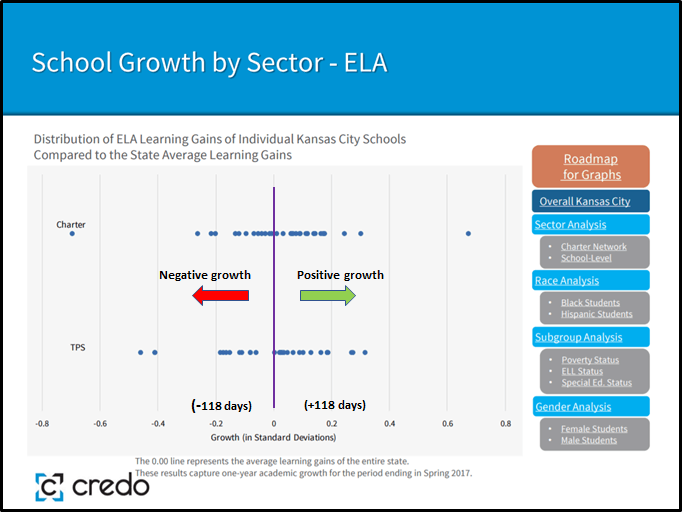
The center line “0”, in purple, represents the average learning gains of the entire state for one school year.
Each dot represents the average growth of one school: to the right are schools in which students are growing at or beyond the MO state average; to the left are schools in which growth is below the state average.
You can see immediately that there’s considerable overlap between Charters and Traditional Public Schools between -.2 and +.2 standard deviations, clustered around the center line.
After that, my eye goes toward the outliers – those dots standing alone, at either end of the growth continuum.
On the right: I’m looking at the six schools (3 KCPS + 3 charter) that are +.2 or more standard deviations from the state average. Students in these six schools are receiving at least 118 days of additional learning compared to their state counterparts. At least three of these schools (those at +.3 standard deviations) are receiving the equivalent of an entire additional year of learning or more.
When I look at these very growth-positive schools I want to know how they’re achieving this level of growth – and what we might learn from them. I wonder whether or not they’re growing to accommodate additional students, or if they plan to replicate.
I also wonder if and how these schools are communicating this growth to prospective families – because I’m guessing that some of these schools, despite their success, have empty seats.
On the left: I see about six schools (2 KCPS + 4 charter) that are more than -.2 standard deviations below the state average. Average growth for these schools is at least 118 days less than the state average.
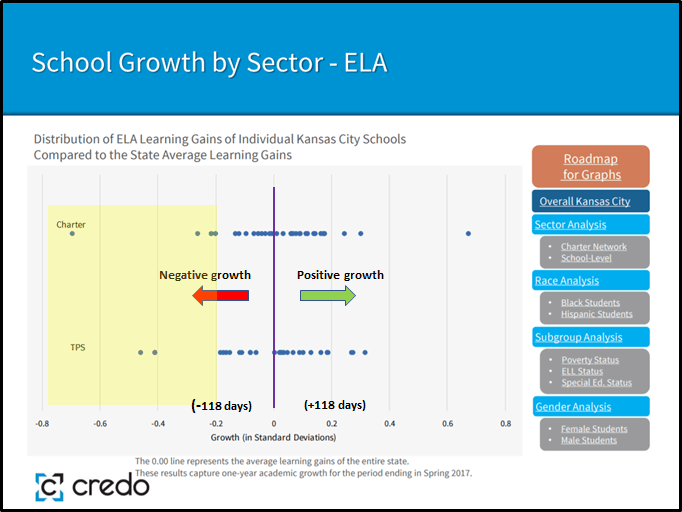
For the three schools (2 KCPS + 1 charter) that are more than (-.4) standard deviations from the center line, students finished the year in Spring 2017 farther behind than where they started in the previous Fall.
When viewed through this growth lens, the case for closing (or re-starting) these schools becomes pretty clear.
When I look at these very growth-negative schools I wonder if they’re still operating (since 2017 our school landscape has changed: three charter schools have closed, and two charters are currently in the midst of turn-around).
For those still operating, I wonder what’s being done, either by KCPS or their charter sponsor, to either re-start or close them.
And I wonder if parents and guardians of students who attend those schools, irrespective of school sector, have any idea that their child is attending a failing school. I’m guessing that most of them don’t.
CURIOUS ABOUT MATH PERFORMANCE?
Here’s what school performance looks like in Math for the 2016-17 school year, broken out by sector.
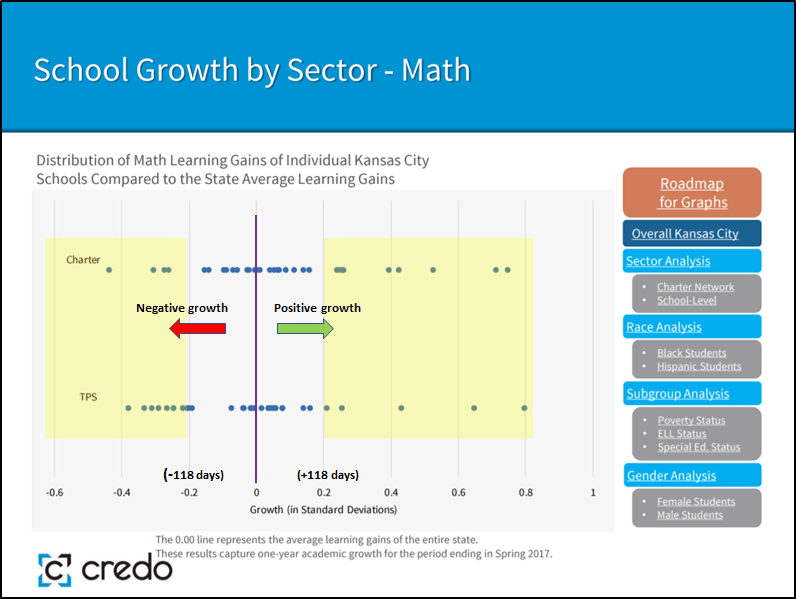
The overall distribution looks a bit different than ELA – there are more growth-negative and positive schools on the two ends of the performance continuum.
Closing thoughts
School quality in Kansas City isn’t a KCPS or charter problem – it’s a shared challenge. Student growth provides a focal point to evaluate school performance in a more objective, data-driven and sector-neutral way.
Our district is small – altogether just ~27,000 students attend around 70 schools. What would public education in our city look like going forward if we reached a consensus that low-performing schools, regardless of sector, shouldn’t operate indefinitely – and we focused our energies on both ends of the performance continuum: closing and re-starting schools on the far left, and incubating, growing and replicating those schools on the right?
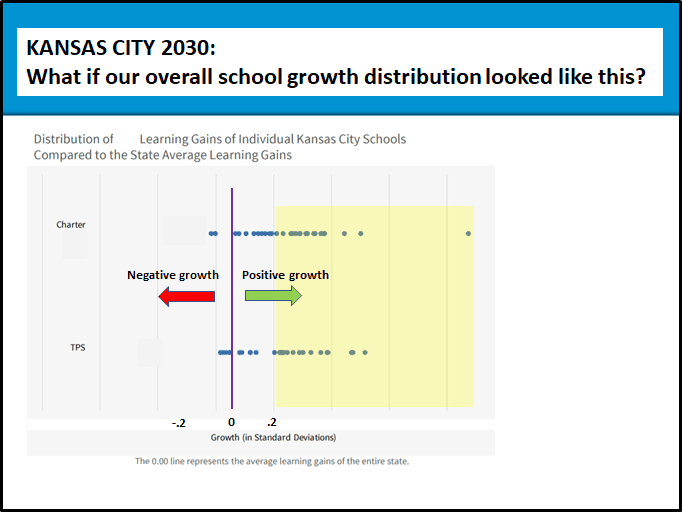
If we pursue this strategy systematically, we could dramatically change Kansas City’s school quality landscape in a matter of years. In the process, we could also increase efficiency.
And if we’re intentional, coordinated, and transparent in conducting this work, these changes can happen in a way that respects students, families and educators – and provides adequate support both to schools and their communities.

For those of you who are interested in learning more about student achievement (absolute scores) v. growth, the PRiME Center at St. Louis University has a new blog post on Missouri’s Annual Performance Report (APR) scores, what they are, and what they miss. It provides a great overview of how APR is calculated – and how it could be strengthened going forward.
One conclusion from their analysis: “An accountability system that more strongly prioritizes growth would provide a closer look at how much schools and districts are actually helping students learn throughout the year.”
https://www.sluprime.org/prime-blog/apr-scores