3 take-aways from the closure of Benjamin Banneker Charter Academy

The idea of school-level accountability is a powerful one. The lessons from Banneker’s closure are important as Kansas City’s charter sector grows, and as KCPS moves more intentionally into charter sponsorship.

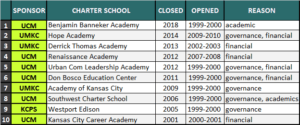
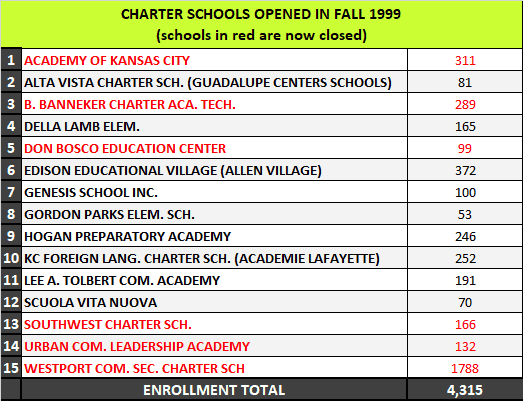
Benjamin Banneker Charter Academy for Technology, a Kansas City charter school, closed over the summer. Banneker was a K-8 school that served 320 students. It was one of the original 15 charter schools that opened in Fall 1999, the first year charters operated in Kansas City – and the 10th KC charter school to close.

Source: MO Dept. of Elementary and Secondary Education; MO Charter Public Schools Association

What can we learn from Banneker’s closure?

First, some background.  Charters are publicly-funded schools that operate independently of traditional school districts.

In charter schools, decisions about time, staffing, money and curriculum are made at the school level. This is what’s known as school autonomy.

In exchange for autonomy, charter schools are held accountable for  academic performance. Performance expectations are laid out in a contract (a charter) and are evaluated regularly by the school’s accountability agent (its sponsor). If a school doesn’t fulfill the terms of its contract it’s supposed to close.

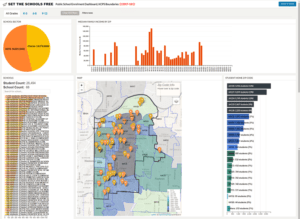
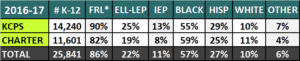
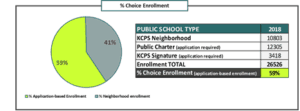
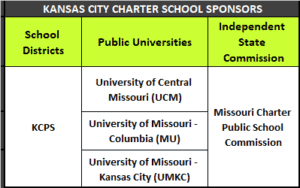
In Kansas City, five sponsors oversee 21 public charter school operators that together educate almost 50% of all public school students.  As accountability agents, the role of sponsors is central to realizing the full potential of the charter school model and its promise to improve school quality.

(Note:  UMKC recently announced its decision to stop sponsoring schools at the end of the 2018-19 school year.)

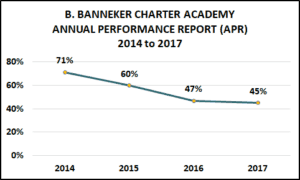
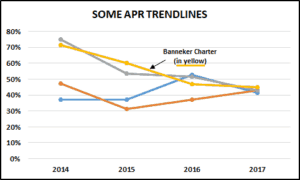
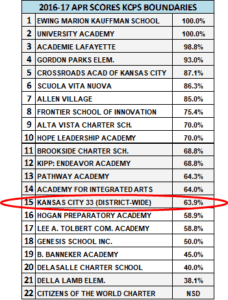
Why close Banneker? Banneker closed because of low academic performance.  Annual Performance Report (APR) scores and other assessments were on a steady downward trend. Teacher and student retention were low. The school hadn’t made progress on its remedial plan.

So when its five-year contract was up for renewal, Banneker’s sponsor, the University of Central Missouri, voted in October 2017 not to renew the school’s sponsorship. You can see the UCM press release here.

Source: MO Dept. of Elementary & Secondary Education

Banneker’s board fought UCM’s decision and tried to find another sponsor. School leaders told parents the school would continue to be open. And legal action taken by the school – still ongoing – complicated efforts to help families looking for new school options. The result was uncertainty and confusion for students, families and staff. When Banneker finally closed on June 30, 2018, the headlines were mostly about families scrambling to find new schools.

What can we learn from Banneker’s closure? As our charter sector grows, and KCPS considers moving more intentionally into sponsorship, it’s important to take stock of the big picture. Here are three key take-aways:

#1:  Autonomy for accountability  – when supported by objective data, high expectations, and a willingness to make hard choices – works. The whole point of charters is to provide families with more quality school options. Autonomy for accountability – the idea that if a school isn’t performing, it should close – is the beating heart of the charter school model.

When this model is supported by objective data, a belief that all students can achieve at high levels, and a willingness to make hard choices, it works.

Banneker’s closure shows us that there is a framework and process in place for regularly evaluating and, if necessary, closing public schools based on performance. It’s called the charter renewal process and, in Missouri, it happens every five to ten years (contract duration is based on historical performance).

The renewal process takes into account a variety of comprehensive trend data related to school governance, academics and finances – and measures that performance against the expectations laid out in the school’s charter. Decisions for renewal, non-renewal, or closure are based on  evaluation of these data.

Is the process perfect? No. Is charter school accountability in Kansas City uneven, does it need to be strengthened? Yes. But the fundamental premise of the model is sound. Banneker’s closure is proof that autonomy for accountability can work.

#2:  School-level accountability shouldn’t just be for charter schools. The idea of school-level accountability – that schools should be evaluated on their individual performance, and that failing schools shouldn’t operate in perpetuity – is another important contribution of public school chartering.

But if you believe that under-performing charters are harmful to the students they serve, then you have to ask:  Why is it OK for failing traditional public schools to operate indefinitely?

Because school quality isn’t just a charter problem.

These aren’t all charter schools

KCPS recently announced its interest in sponsoring more charter schools (the district currently sponsors one charter school, the Kansas City Neighborhood Academy). It’s an intriguing idea but merits the question:  can you be an effective charter sponsor if you’re unwilling to apply the same accountability principles to your own schools?

(It’s important to remember that there are alternatives to neighborhood school closure. A number of districts – like Atlanta Public Schools, which I wrote about in September – are coming up with innovative ways to bring together the best of both charter and traditional public schools in a neighborhood context. These models hold promise, and are worth our attention.)

#3:  We need more visibility into school performance. As I tried to understand Banneker’s closure and put it in context with the performance of other public schools, this was probably my biggest take-away: we need more visibility into public school performance, both at the individual school level and in aggregate.

Source: Banneker Charter Academy website

Because it’s really hard to have a thoughtful conversation about schools, or about school quality, when you don’t have access to meaningful information – or when the information you do have is conflicting.

Let’s be honest – school performance, for most of us, is a big mystery. There’s a lot of data on DESE’s website, yes. APR scores are helpful. But most of us don’t have access to sophisticated data analysis. We have no idea how individual schools perform, how absolute scores differ from student growth, how performance data looks over time – or whether or not it’s even appropriate to compare one school’s performance to another, given the population of students they serve.

We need to figure out a way to make school performance data more easily accessible and understandable – for parents, for schools, and for the broader Kansas City community.

Far from being a threat, creating a culture of openness around school data would actually make it a lot easier to problem-solve, to help schools improve, and to learn from our mistakes. It would also protect the interests of school board members (both KCPS and charter), school leaders, and charter school sponsors who are tasked with making hard decisions that affect students and families.

And it would go a long way in helping to both inform and normalize the conversation on school quality in Kansas City – a topic we should be talking more about.

__________________

These are my biggest take-aways from Banneker’s closure. What are yours?  Feel free to leave a comment below.

Share

Partnership schools: Moving beyond “either/or” to “both/and” in Atlanta

Atlanta Public Schools are harnessing the strengths of traditional public and public charter schools to transform their lowest-performing schools. This model holds promise for Kansas City

Imagine a traditional neighborhood school with a defined enrollment boundary that serves all students within that boundary. Like any traditional neighborhood school, it follows the district’s transportation and discipline policies. From the outside it looks like any other district school.

This school, however, is different. Because unlike a traditional school, where key decisions regarding time, money, staffing and curriculum are made in the district’s Central Office, key decisions at this neighborhood school are made by school leaders, at the school level.  The school’s support and out-of-school programs, consequently, are designed to meet the unique needs of the school’s students and surrounding neighborhoods, rather than through a one-size-fits-most approach.

And because of this more tailored and neighborhood-specific approach, and because of site-based control (that is protected under contract), more organizations are willing to partner with the school, resulting in more community investment in the neighborhood – and, ultimately, reduced student mobility and higher academic outcomes.

Innovating in Atlanta

The school I described above actually exists. It’s Thomasville Heights Elementary School, one of several Atlanta Public Schools “partnership schools,” an effort by APS to turnaround its lowest-performing neighborhood schools by partnering with proven non-profits to operate them.

Thomasville Heights and three other APS schools – an elementary, middle and high school – are run by Purpose Built Schools Atlanta (PBSA), an Atlanta-based non-profit with a community development-centered approach for running schools. Another APS neighborhood school, Gideons Elementary, is run by Kindezi Schools, a local charter school operator with an innovative family-sized classroom model of six to eight students per class. The five schools these organizations took over – which together constitute a K-12 feeder pattern – were the lowest-performing in the APS system.

The APS rationale for these partnerships? It’s refreshingly straightforward: “For some chronically low-performing schools, the needs outweigh the resources that APS can offer on its own. In these cases, we partner with organizations that specialize in school turnaround and can provide the structure, insight and expertise needed.”

APS partnership schools remain traditional APS neighborhood schools and part of the APS family. They operate according to APS policies regarding enrollment, transportation and discipline. They’re not application-based, and they can’t turn students away. They serve all grades. And their enrollment numbers and performance scores are reported under the district.

Time, staffing, money & curriculum 

But, unlike their traditional neighborhood counterparts, decisions about time, staffing, money and curriculum (a school’s most important resources) are made at the school level. This is built in to their contract. And in exchange for this autonomy, districts holds partnership schools accountable for their results. This is part of the contract, too.

The APS-PBSA partnership at Thomasville Heights is now in its third year; Kindezi’s partnership at Gideon is in its second. It’s still early, but results are promising. Enrollment is growing. Test scores are up. Because non-profits tend to be more agile and successful at fundraising than centralized school districts, partner schools are benefiting from additional philanthropic investments in pre-school and out-of-school programming. One of those investments is a program that embeds housing lawyers in neighborhood schools to serve the community on a pro bono basis. This investment, which started at Thomasville Heights Elementary under Purpose Built, has helped contribute to a significant reduction in student mobility.

Moving from “either/or” to “both/and”

You could think of Atlanta’s partnership model as “neighborhood schools 2.0.” It’s an approach that brings together the strengths of traditional district neighborhood schools with some of the strengths of the public charter school model. And it’s one way of helping us move the district-charter conversation from “either/or” to “both/and” to improve outcomes for all students.

This partnership model isn’t unique to Atlanta. Rather, it’s a hybrid approach that’s increasingly being used in urban districts grappling with chronically low-performing schools and declining district enrollment – conditions we face here in Kansas City. Rather than closing struggling schools, or letting them gradually be supplanted by new charter schools, these urban districts are taking charge and incentivizing qualified operators, through a competitive process, to instead partner with them. Both parties can win.

In Camden, New Jersey and Philadelphia, Pennsylvania these district-charter partnership schools are called Renaissance Schools. In Indianapolis they’re called Innovation Network Schools. In San Antonio they’re often called 1882 schools, after the legislation that enables them.

The model varies from district to district (some are neighborhood, others are open-enrollment or specialty schools) and operating agreements are negotiated to reflect both district and partner priorities.  But the general contours remain the same:  the district provides the school building, students, per pupil funding, and select services; the non-profit provides the school model, staffing and expertise, and additional program resources to support the school and school community – and is held accountable by the district for school performance.

Districts that are serious about pursuing partner schools as a strategy for school improvement usually establish an Office of Innovation to support their work.  And in cities where a unified enrollment system exists, the district often requires partnership schools to participate in the unified process, bringing additional equity and coherence to a fragmented system (Note: Atlanta does not have a unified enrollment system. Other cities with partnership schools – such as Camden, NJ and San Antonio, TX, do have unified enrollment – and the district requires partner schools to participate).

I’ll continue to write more about partnerships, and other strategies for district-charter collaboration, in future posts. But as we try to find our way onto a more equitable, coherent and higher quality path for Kansas City’s schools and students, I think the basic outlines of the partnership model – capitalizing on the strengths of both traditional district and charter schools while facilitating greater cross-sector collaboration – hold a lot of promise.

___________________

Up next:  What we can learn from the recent closure of Benjamin Banneker Charter Academy for Technology, a Kansas City charter school.   

Share

KC Public School Enrollment Dashboard (Updated for 2017-18)

The KC Public School Enrollment Dashboard brings together 2017-18 school enrollment data with student zip code and median family income in a visual format to bring more transparency to our public schools landscape

Just in time for the end of the school year – the KC Public School Enrollment Dashboard is now updated with provisional 2017-2018 enrollment data! You can still access the 2016-17 data by toggling between the two years using the blue date button in the top right-hand corner of the dashboard.

Launched in Fall 2017, the Enrollment Dashboard initially focused on grades 9-12 only. In early 2018 it grew to include all grades K-12 for public schools within KCPS boundaries, both district and charter. Over the past few months it’s been one of the top hits on Set the Schools Free.

The dashboard is an important contribution because it introduces a much-needed layer of transparency to our system of public schools and the students they serve:  it shows the full universe of public school options within KCPS boundaries including where schools are located, the number of students they serve, and in which zip codes those students live -all sortable by school sector, school, and/or zip. It’s also an important visual reminder of the complexity of our public schools landscape.

For those of you who use the dashboard, I’d love to hear how you use it for your work and what functionalities might make it more useful to you going forward. Feel free to leave a comment or contact me directly. Thanks!

Share

Let’s find the middle path between an all-KCPS and all-charter system

The path we’re on – one in which the number of public schools continues to grow while low-performing schools, both KCPS and charter, operate indefinitely – is unsustainable. How do we get on a more equitable, coherent, and higher quality path? 

This week I had an op-ed published in the Kansas City Star:  “Kansas City can find a middle path between district-run and charter schools.” It’s a response to the guest commentaries written by KCPS school board member Jennifer Wolfsie and University Academy Board Chair Bush Helzberg in which they share their KCPS and charter perspectives, respectively, on the future of public education in our school district.

My op-ed builds on a lot of the themes I’ve written about over the last two years in Set the Schools Freeour changing public school enrollment landscape, what our growing charter sector is telling us, and the need to find a middle path between an all-KCPS and all-charter system. Because there are, of course, strengths and weaknesses to both ways of operating schools.

Partnerships  are one way we can capitalize on the strengths of a centrally-coordinated system while leveraging the flexibilities and autonomies of the charter school model. There are others. If we’re committed to building a more equitable, coherent and higher quality system of schools, let’s be open to exploring all the different options available.

You can find my op-ed, and links to the Wolfsie and Helzberg pieces, here.

Share

Student demographics within KCPS boundaries – Part II: An analysis

I recently posted Student demographics within KCPS boundaries – Part I:  The data, a summary of the demographic data for all public school students, KCPS + Charter, from 2007 to 2017. There are a lot of numbers, and it can be hard to make sense of what’s actually happening. This post will help you sort it all out.
____________________

THE BIG PICTURE. Our public school student population (KCPS + charter schools) is smaller than it was in 2007, and it’s changing:  the number of Hispanic and multi-racial students is growing; the number of black students is decreasing.

Poverty in our schools is more concentrated: although we have fewer total students who are eligible for Free & Reduced Lunch than we did a decade ago, these students today make up a higher percentage of our overall student population.  We have more students who are English Language Learners or have Limited English Proficiency (ELL-LEP). The percentage of students with Individualized Education Plans (IEPs/Special Education) remained about the same, though the number of students with IEPs decreased overall. (Note: to see the data on which this analysis is based, click here.)

Here’s a more in-depth analysis that includes breakdowns by sector:

  1. Overall school enrollment is down 15% from 2007 – but starting to rebound. You’ve heard this here before, but it’s worth repeating: After hitting a low in 2014, overall enrollment has slowly begun to rebound – if you include 2017-2018 data, we’ve had four consecutive years of growth in public school enrollment. KCPS enrollment, though not growing consistently, has steadied in the past few years.
  2. Hispanic students are the fastest growing demographic in our district. Enrollment of Hispanic students increased by nearly one-third over the last ten years; more than a quarter of all students in our district today – 27% – are Hispanic. The charter sector is capturing most of this growth:  Hispanic student enrollment in charter schools increased nearly five-fold, from 591 to 2,920 students.
  3. Enrollment of white students is down overall – but starting to grow. KCPS lost almost half of its white students (~1600 students) in the span of just one year with the 2008 annexation of 7 KCPS schools to Independence School District. Consequently – and despite growth in the charter sector – there are fewer white students in our district today than 10 years ago. Since 2014-15, white enrollment has grown in both sectors; in 2017, there were almost as many white students in charter schools (1271) as there were in KCPS schools (1400).
  4. Enrollment of multi-racial, Asian, Indian and Pacific Islander students is growing. Because of their comparatively small numbers, these students are grouped together as “Other”. Since 2007 the number of students identifying as one of these groups has more than doubled, both in KCPS and the charter sector. Growth in enrollment of students who identify as multi-racial accounts for most of this increase (Note: “Multi-racial” became an option for reporting race/ethnicity for the first time in 2011, which probably accounts for some of this increase – and a corresponding decrease in other categories).
  5. Poverty, as measured by student eligibility for Free & Reduced Lunch status, has become more concentrated. Our student population is smaller, but their needs have increased. The number of students eligible for Free & Reduced Lunch comprises a higher percentage of our student population today than in 2007, both in KCPS and charter schools.
  6. The number of ELL-LEP students is growing. Between 2007 and 2017 the number of ELL-LEP students grew from 3,978 to 5,710 students; one of every five students in our public schools is an English Language Learner or has Limited English Proficiency (in KCPS it’s one of every four students). Most of this growth occurred in the charter sector:  the number of ELL students in charter schools more than doubled – from 922 students in 2009 to 2,184 students in 2017.
  7. The overall percentage of IEP students in public schools remained flat. While the number of IEP students declined overall, the overall percentage of IEP students in our district stayed about the same. The number of students with IEPs in charter schools more than doubled – from 415 students to 921. The number of IEP students in KCPS schools declined by more than 40%, from 3,203 students in 2007 to 1,798 in 2017.

___________________

It’s not really a surprise that, across the board, the biggest growth in most demographic categories is in the charter sector; for most of the past decade, KCPS has been losing enrollment. KCPS, on the whole, continues to serve more students with FRL, ELL-LEP, and IEP status, both on a percentage basis and in absolute numbers, than our charter schools.

What is surprising, however, is the extent to which one demographic group – black students – is driving the changes within our district:

The decrease in black enrollment represents the largest demographic shift in our district over the last decade.

Over the last 10 years more black students have left our public schools than any other demographic. Black student enrollment in KCPS dropped by 50% in the last decade, from 15,743 students in 2007 to 7,796 students in 2017.  Although black enrollment in charter schools grew (by 1,987 students) we still had a net loss of 5,960 black students, district-wide.

If you look at US Census Data from 1980 to 2014  compiled by the City’s Planning Department, you can see that the black population within KCPS boundaries has been declining for the past few decades (the only groups whose overall numbers are growing, according to the Census, are Hispanic and multi-racial families).

But the 50% rate at which KCPS black student enrollment has declined exceeds the rate of decrease for both the black population in general (-22%) and black children under 18 years of age (-37%) between the years of 2000 and 2010/14. (Note: the time periods I’m comparing don’t overlap completely, but are meant to provide a general benchmark/point of reference).

A few closing thoughts

This demographic analysis is big picture. It tells us, in the broadest possible terms, what our student population looks like and how it’s changed over the past decade.

It doesn’t tell us anything about what our student population looks like at the individual school level:  how segregated – or diverse – our schools are, and how that’s changed over time. And it doesn’t tell us why black students, or students with IEPs, are leaving our school district.

In short, it leads to a lot of questions that merit further exploration and consideration.

But knowing the facts – that is, who’s actually attending our public schools, both KCPS and charter, and what their needs are – is a good place to start the conversation.

____________________________________

If you have any interesting insights or observations based on the data, please share them! Leave your comment or question in the comments section below.

Share

Student demographics within KCPS boundaries – Part I: The data

Who are our public schools serving, and how has this changed over time? What does our overall student population look like with respect to race & ethnicity, economic need, English proficiency and special education? And how does it look when broken out between KCPS and our charter sector?

After posting the 2017-18 Enrollment Analysis, KCPS Boundaries last month, several readers inquired about the demographics of our public schools. Who are our public schools serving, and how has this changed over time? What does our student population look like with respect to race & ethnicity, economic need, English proficiency and special education? And how does it look when broken out between KCPS and our charter sector?

Here’s the short answer:

And a quick comparison of our public school student population over the last ten years:

To get to the longer answer, I’ve put together a summary of Student Demographics for KCPS Boundaries spanning from 2007 to 2017.

For each category – Race & Ethnicity and then Free & Reduced Lunch (FRL), Limited English Proficiency (LEP) & Individualized Education Plans (IEP) – I start with an overall district-wide summary (KCPS + Charter) and then break it down by sector. I try to show the data a few different ways, to make it easier to understand.

To help make sense of the data and what it means for our district I’ll be posting Student Demographics Part II:  An Analysis, soon. In the meantime, though, I wanted to make the data available for those who might be interested. I hope you find it useful.

Note:  You can access the raw demographic data, by building level or district, here.  2017-2018 data will be published at the end of the school year.


Share

2017-18 Public School Enrollment, KCPS Boundaries

Public school enrollment grew for the 4th year in a row in 2017-18 and kindergarten enrollment reached the tipping point – for the first time there are more kindergarten students in Kansas City charters than in KCPS schools

DESE recently posted preliminary enrollment data for the current 2017-2018 school year. I’ve put together a 2017-18 Public School Enrollment Analysis for KCPS Boundaries to help us all better understand what these data mean for our school district.

The big take-aways? 1) Overall public K-12 enrollment is growing, which is great news; 2) enrollment continues to shift toward our charter sector, whose growth outpaces KCPS – for the first time in our school district, we have more kindergarten students in charter schools than in our traditional public schools. And, 3) six of 10 students attend public schools (KCPS signature or charter) that require an application to attend.

The continued enrollment shift toward charters has important policy implications (more on that in my next post) but also has program implications for non-profits that engage with our schools. For example, if you’re running any type of school-based K-12 program, it’s important to know where the students are – you can no longer assume that because you’re partnering with KCPS you’ll automatically be reaching the majority of students in our district. Developing a better understanding of enrollment trends, then, can help you build a better program.

Here are some key data points from this year’s enrollment data that I think are worth noting:

I.  OVERALL PUBLIC K-12 ENROLLMENT

  • Overall public school enrollment is up, from 25,839 to 26,526 students. This is the 4th year in a row that public enrollment has grown, after hitting an all-time low in 2013-2014
  • 46% of all K-12 public school students now attend public charter schools.  Charter enrollment grew 6%, from 11,599 students to 12,305 students this year
  • KCPS K-12 enrollment held flat/decreased slightly from 14,240 in 2017 to 14,221 this year

II. KINDERGARTEN ENROLLMENT

  • More than half of all kindergarten students now attend public charter schools. For the first time, charter schools serve the majority (51%) of kindergarten students in our district
  • Overall public kindergarten enrollment is up this year. This is the first time kindergarten enrollment has grown since 2014-2015
  • Both KCPS and charter kindergarten enrollment grew in 2017-18.  KCPS grew by 14 students; charters grew by 67 students

III. ENROLLMENT BY GRADE SEGMENT: K-5, 6-8, 9-12

  • The K-5 market is approaching the tipping point: charters now serve 48% of all K-5 students. K-5 charter enrollment has grown by 23% over the last 5 years; KCPS K-5 enrollment decreased by 4% over the same period
  • The majority of 6-8th grade students in our district attend charter schools
  • KCPS market share in high school decreased slightly from last year to this year due to charter school growth in grades 9-12

IV. ENROLLMENT BY SCHOOL TYPE: KCPS Neighborhood, Signature & Public Charter

  • 6 of 10 public school students attend schools that require an application to attend (KCPS signature or charter); 4 of 10 public school students attend non-application based KCPS neighborhood schools
  • Of KCPS students, 1 in 4 attends a signature school; 3 of 4 students attend neighborhood schools 

For a more in-depth look at these numbers and more, take a look at the 2017-18 Enrollment Analysis, KCPS Boundaries.

In my next post I’ll be writing more specifically about the policy implications of our shifting public education landscape.

To that end, I’d like to know – what are some of your concerns as charter schools are on track to serve more students than our traditional public school system?  What are we potentially losing – and/or gaining? Leave a comment, I’d love to hear from you.

You can find the Preliminary 2018 Building Enrollment Data on DESE’s website here.   

Share

Fixing high school in Kansas City: Why “re-investment” isn’t enough (and partnerships are a great idea)

As a stand-alone strategy, “re-investment” – the idea that if more families would re-invest in the high schools we have, our schools would improve – doesn’t benefit all schools equally. This is one reason why the KCPS Board of Education’s recent approval of guidelines to evaluate new school partnerships is so important.

There are a few competing philosophies right now on how “to fix” high school in Kansas City. The one I hear most often is what I call the “re-invest” approach.

According to this perspective, Kansas City doesn’t need more high schools – we already have too many. If everyone would just re-invest in the schools we have, our schools would improve: with more students in classrooms and more engaged families supporting our schools, there will be more course offerings, more sports and extra-curricular programs – and, consequently, more academic success.

To be clear, re-investing in “schools we have” means re-investing in KCPS high schools. KCPS currently serves about 70% of our public high school market. KCPS high schools are bigger than charter high schools (three times the size, on average – click on graphic below) and offer a more traditional “big high school” experience. KCPS schools also have the deepest roots in our community – and the most at stake when new charter high school options open.

I’ve heard the re-invest argument from KCPS administrators as an explanation for why our schools continue to struggle – we need more parent and community involvement. I also hear it a lot from KCPS parents whose children go to signature schools (KCPS schools with special themes or programs that require an application to attend). And I get it: they’ve found something that works well for their children; they believe in diverse public schools and want to help KCPS grow. If other parents similarly re-invested, they reason, our schools would improve.

There is important logic to this argument. Because racism and white flight following desegregation led to the decline of our school district, it’s incumbent upon white middle income families to re-invest in the system to help fix it.

But relying too heavily on “re-investment” to improve school performance – as I think we’ve been doing – doesn’t benefit all schools equally. I’ll explain why.

Imagine you’re a parent looking for a high school for your child. You have choices. Which school from the below list would you choose? Which school do you think other families would choose?

Did you pick option #3?

It’s not a trick question, I’m just trying to make a point. Most people, when given choices and adequate information about those choices, will gravitate to those options they perceive as “best.” This is human nature.

Option #3 has the top scores in all three categories. It probably won’t surprise you that it’s Lincoln College Prep, a KCPS signature school that requires students to test in.

And herein lies my biggest worry with relying too heavily on re-investment:  as a stand-alone strategy, “re-investment” primarily benefits KCPS signature schools – with only limited spillover effects to other schools.

So Lincoln benefits from re-investment, yes. But what about the other four KCPS high schools that aren’t signature schools and don’t have entrance requirements? There are two schools on this list with attendance below 50% and in which *no* students scored above the national average on the ACT (which, in case you’re wondering, is 21). As I wrote last month, it’s these schools that are losing students – on average, 40% of enrollment between 9th and 12th grade.

What’s our plan for helping these schools?

It’s in this vacuum that new charter high schools are opening.

_________________________

There are a few other reasons I’m wary of relying too heavily on re-investment in existing schools to improve school outcomes:

– It’s a slow process that doesn’t take into account the urgent need to fix failing schools.  If your child doesn’t attend a failing school it’s a lot easier to take the long view on school improvement. It’s hard to relate to that school’s problems – or to understand the urgency felt by a parent whose child does.

– It stifles innovation by externalizing responsibility for school performance. It puts the burden of school improvement on parents and the community – and on students – rather than on schools and the systems that operate them.

– And it doesn’t take into account the growing number of charter high school options becoming available – options that will inevitably cut into KCPS enrollment in all grade segments.

So what’s a better strategy?

High school is our last chance to make learning relevant for students, to prepare them for real life outside of school. This is why Kansas City’s high school problem deserves our time and attention, and requires our best and most innovative thinking.

Because if we want students and families – of all races and socio-economic backgrounds – to make “better” choices, we need to give them better options to choose from.

Right now, the quickest path to starting a new high school or introducing a new school model within KCPS boundaries is to start a public charter school. As I’ve written before, there are several new charter high school initiatives under way.

What would happen if KCPS instead incentivized new school leaders and community initiatives, through a transparent and competitive process, to work in partnership with KCPS to help improve our supply of public high schools? And then was able to direct those schools operators to where they were most needed?

By opening the door to these types of community collaborations, the KCPS Board of Education’s recent unanimous approval of school partnership guidelines is an important first step in the direction of building a more coherent, equitable and innovative system of public schools for students and families in our district.

________________________

To read the approved KCPS Board Principles for Education Collaboration & the accompanying presentation from the January 24, 2018 board meeting, click here

To see a full list of public high schools within KCPS boundaries with attendance, graduation and ACT data, click here.


Share

Does Kansas City have too many public high schools?

With student enrollment declining by more than 40% between 9th and 12th grades, public high school in Kansas City feels more like a leaky pipe than a saturated marketplace. Are we asking the right questions? 

One of the biggest questions in our ongoing high school conversation is:  don’t we already have too many?

During the 2016-2017 school year there were 14 public schools serving about 5,800 students. The biggest, East, served ~1000 students. The smallest, Allen Village, served less than 200.  Several schools had empty seats.

Right now in Kansas City there are at least three new high school initiatives underway.

Does Kansas City really need more high school options? Shouldn’t we just try to fill the seats we have?

_____________________

Since we live in a choice system, I thought it would be interesting to look at the enrollment choices families and students are making as they move through our public school system.

Let’s start by looking at the Class of 2017.

The Class of 2017

It’s Fall 2004. About three thousand students show up for their first day of Kindergarten in both KCPS and charter schools.

As these students move through the system year-to-year, class enrollment begins to shrink: by the time they reach sixth grade, the Class of 2017 is down to 2,000 students.

Enrollment declines until ninth grade, when this cohort gains students (research shows that more students repeat 9th grade than any other, resulting in a “ninth-grade bump”).

This bump, however, is followed by an enrollment cliff – a 30% drop – where the Class of 2017 loses more than 500 students between 9th and 10th grade. This enrollment drop represents the largest single loss of students – both in absolute numbers and by percentage – in this cohort’s K-12 experience. And it happens during high school.

By senior year, Fall 2016, the Class of 2017 is just 1100 students, one-third of its original size. And this is months before graduation.

Overall, Class of 2017 enrollment shrinks by almost 40% between grades 9 and 12 – a loss of 710 students over four years.

And between Kindergarten and 12th grade, enrollment shrinks by 1,847 students – more than 60%.

What about other graduating classes?

This enrollment profile is illuminating, but represents the experience of just one cohort of students as they move through the system.

What does the data look like, on average, for the last five graduating classes, going back to 2013? And how do these enrollment stories differ between KCPS and charter schools?

Here’s a graph that summarizes year-to-year enrollment for the last five graduating classes within KCPS boundaries, from Kindergarten through 12th grade.

The story is remarkably consistent:  for the classes of 2013 through 2017 there’s a steady decrease in enrollment from fall of Kindergarten year through fall of 8th grade.

After a bump in 9th grade, enrollment declines again – by 47%, on average, between 9th and 12th grade.  (Click here to see year-to-year data for all five classes).

Here’s another look at the same data, broken out by school sector (KCPS and charter).

As these five cohorts move through the system, the charter sector, on average, gains students every year until grade 7. Starting in 8th grade, charter enrollment begins to decline.

KCPS, on average, loses enrollment every year except for grade 9.

High school is the only place on our K-12 continuum that both KCPS and charter schools lose student enrollment overall. Key take-away:  High school isn’t just a KCPS or a charter problem.

Why does this matter?

Context is important for any conversation. Over the past several years the number of students choosing public high school within KCPS boundaries has decreased.  Of those enrolled, nearly 5 of 10 students exit the system, on average, between the fall of their 9th and 12th grades. And the number of students who actually make it through to graduation is even lower.

Where are these students going? Enrollment numbers alone can’t tell us. Some are leaving the district altogether. Others are going to private schools. Far too many are dropping out entirely.

It’s against this backdrop that the overall high school debate in Kansas City is taking place.

Based on these data I’m not sure that “Do we have too many high schools?” is the right question to be asking. Looking closely at the numbers, high school in Kansas City feels more like a leaky pipe than a saturated marketplace.

A better question might be:  does Kansas City have enough quality public high school options, high schools that families want to send their kids to -and where kids want to be – that are doing great things for students of all socio-economic backgrounds?

The scope of this problem requires more than a one school solution.  How can we work together to fix it?

Share

School autonomy 2.0: Can we do this a better way?

If we can separate the key premise of charter schools – autonomy for accountability – from the negative politics that surround them, could we get farther in improving all of our schools?

The Kansas City Star editorial board recently wrote, in response to KCPS falling short of full accreditation, that “charter schools aren’t the salvation” for public education in Kansas City.

Although KC charters perform better than The Star would suggest (see chart), real changes are needed to strengthen the accountability environment for Missouri charter schools. In the absence of these changes,  The Star is probably right:  charters on their own won’t be our salvation.

Then again, I’m wary of ever relying on a single solution to solve really hard problems.

But the paper’s vague calls for “heightened efforts from educators” and more community involvement in support of KCPS, while important and well-intentioned, aren’t likely to get us very far either.

It’s our responsibility as adults to create successful learning environments in schools.

And when that learning environment isn’t working – when student proficiency is continuously low, when we have schools that we’re unable to staff properly, or even recruit substitute teachers for – we have a responsibility to change that environment.

­­­­­­­­­

But to hold schools accountable in this way, you must first give them real power over staffing, curriculum, and budget. These are the biggest levers a school leader has to change the overall trajectory of a school.

When implemented with fidelity and rigor, we know this charter school model for organizing and operating schools works (see the research here).

Accountability is mentioned eight times in the KCPS 2018-2023 strategic plan. But it’s this word –autonomy – that’s altogether missing.

Is there a way to do “autonomy for accountability” better?

So I’ve been wondering recently:  Can we take this core idea of “autonomy for accountability” that charter schools represent, and do it better?

Because if you can separate the idea of charters from the negative politics that surround them, there’s so much about the model that makes sense – and that most of us, I think, would actually agree on:

  • That school leaders should be able to make staffing, curriculum and budget decisions in the best interest of their students and school communities.
  • That there should be fewer layers of bureaucracy – less distance – between parents and school staff.
  • That schools should be evaluated regularly and held accountable for their academic performance. Failing schools shouldn’t be allowed to fail students year after year.

Is there a way that we harness these powerful ideas on behalf of KCPS and its students, rather than at the district’s expense?

The short answer:  Yes!

I’ll explore this idea in more depth in my next post.

_________________

A note on APR scores:  APR scores are a bundled score of individual metrics that our state department of education uses to evaluate school performance on an annual basis.

DESE just released 2017 district-level scores for the state of Missouri last week. Scores are based on academic achievement, sub-group achievement, college and career readiness, attendance, and graduation rates.  Here’s a good article from the News Tribune in Columbia, MO from January 2017 that explains in more depth what the APR is:  “What is the Annual Performance Report?”

If you’re interested in the raw data that breaks down scores based on individual metrics, you can find these data for the last four years on the DESE website: click  here and then on “Missouri 2017 APR Summary by districts”.

Share