Teacher demographics in Kansas City, Part II: 2000-2018

Kansas City’s public education landscape is changing. Changing teacher demographics, and a shifting employment landscape, are important parts of this larger story.

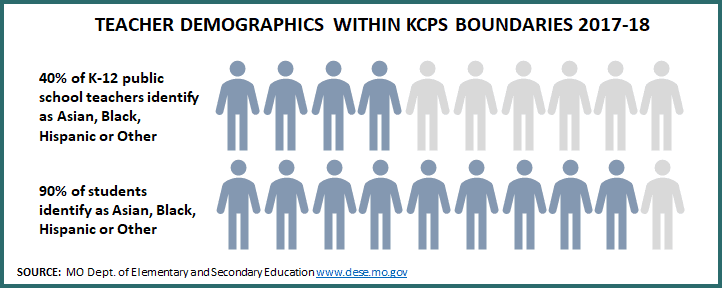
My last post looked at teacher demographic data within KCPS boundaries during the 2017-18 school year. I started with one year of data because it’s important to have a baseline, and to know what our teaching staff looks like today.

But looking at a single year of data in isolation doesn’t tell us the whole story. What’s the big picture?

2009 is when teacher demographics within KCPS boundaries begin to shift, on a percentage basis. As a result, this post focuses on demographic data from 2009 to 2018.

Overall, an increasing percentage of our teacher workforce is White. In both KCPS and the charter sector, the percentage of White teachers has grown over time. Representation of Asian and Hispanic teachers has increased marginally. The percentage of Black teachers has steadily decreased.

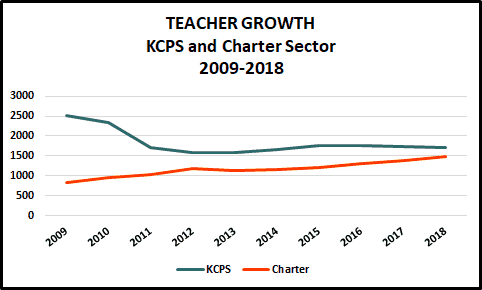
This analysis holds true for both KCPS and the charter sector – though under somewhat different conditions: overall contraction in the KCPS teacher labor pool, and overall growth in the charter sector.

The number of KCPS decreased from 2009 to 2018; the number of charter school teachers grew.

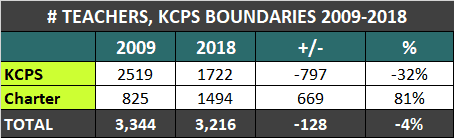
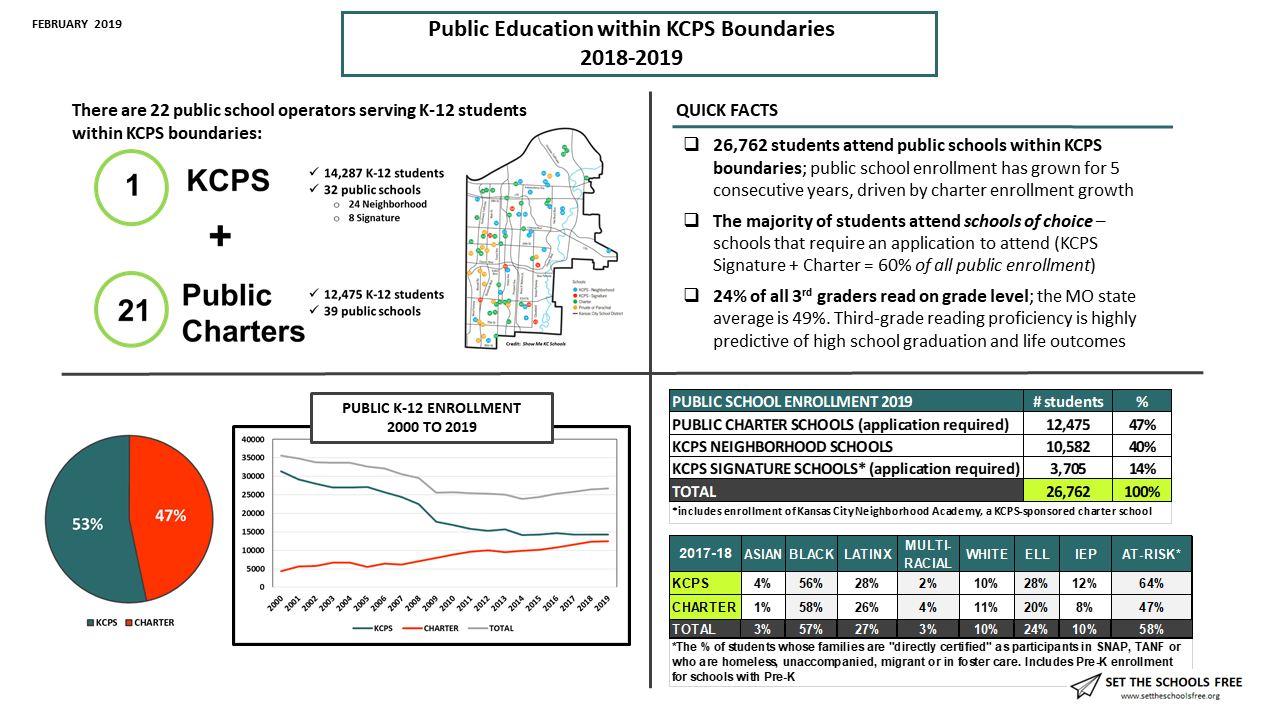
KCPS remains the single largest employer of teachers. But, similar to K-12 student enrollment, we’re quickly approaching a teacher “tipping point”: in 2018, 46% of all public school teachers within KCPS boundaries taught in public charter schools.

The number of teachers in charter schools is growing, driven by growing student enrollment. In 2018, 46% of all students attended Kansas City charter schools. 46% of all teachers taught in Kansas City charter schools.

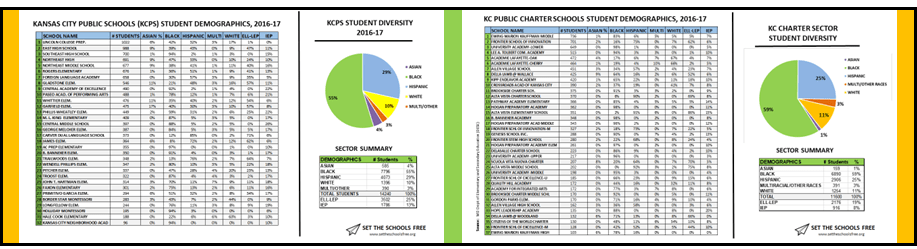
A quick look at student demographics

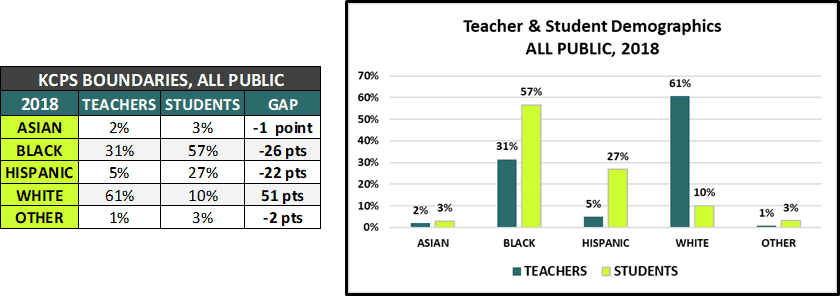
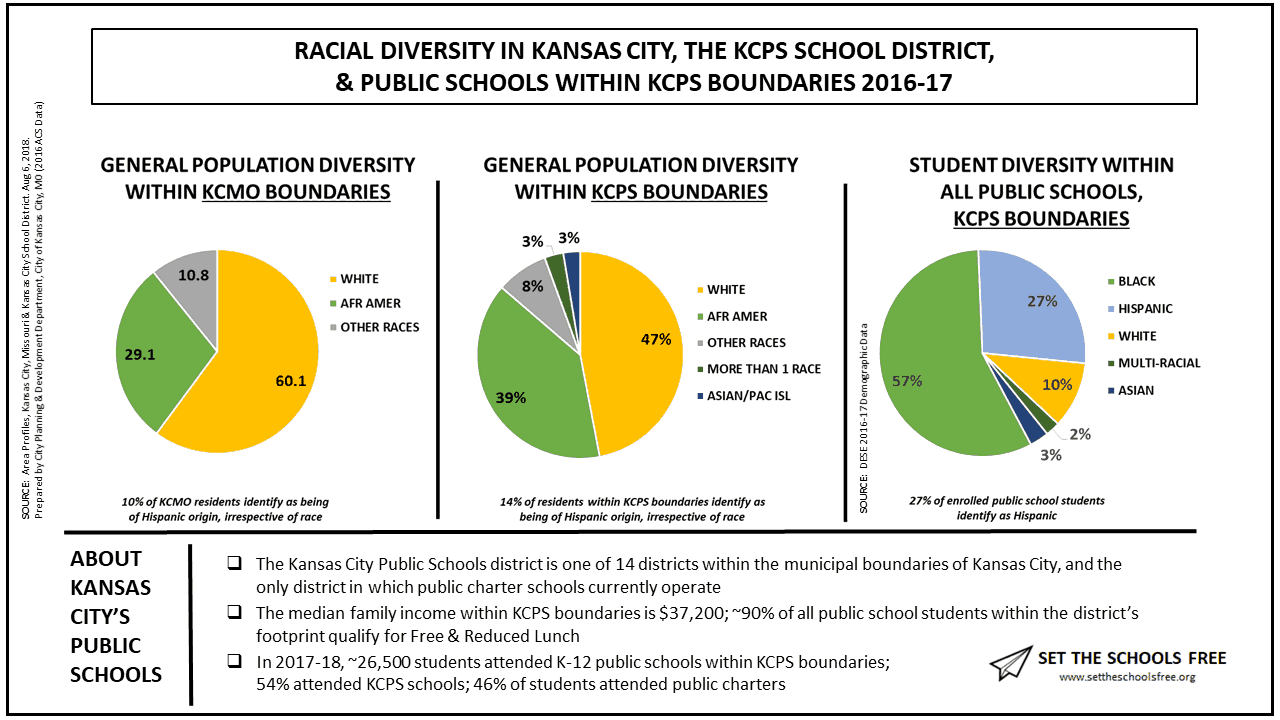
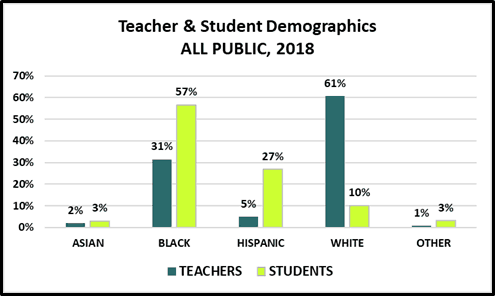
It’s important to understand teacher demographics in the context of the student population our schools serve. The next few sections break out the trend data in three ways: 1) ALL public (KCPS + Charter), 2) KCPS, and 3) Charter. To keep things simple, I don’t go into student demographics in detail – you can find a detailed analysis of student demographics over time here. But the broad 2009-2018 student trends are:

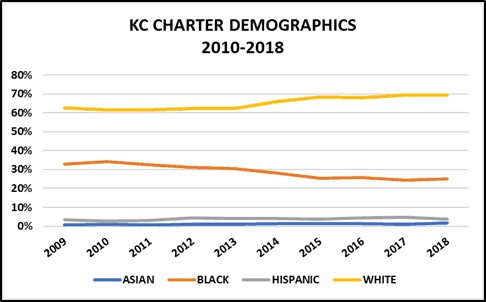
  • Asian student enrollment: Slight growth in both KCPS and the charter sector
  • Black student enrollment: Trending down in KCPS, growing steadily in charter sector (net loss overall)
  • Hispanic student enrollment: Trending up in both KCPS and charters (Hispanic students are the fastest growing demographic in our district)
  • White student enrollment: Slightly down in KCPS; trending up in the charter sector
A quick look at how teacher and student demographics compare within KCPS boundaries in 2018.

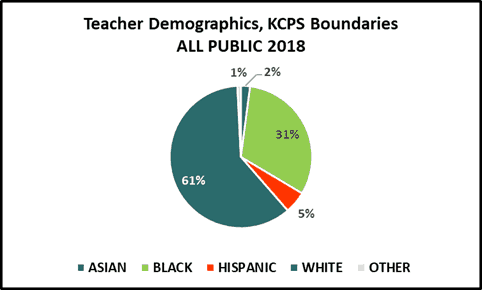
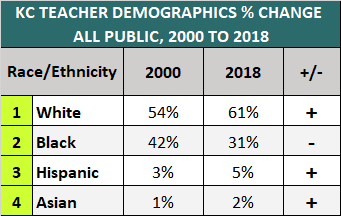
Teacher demographics, ALL public

In 2000, a majority of public school teachers within KCPS boundaries – 54% – self-identified as white. Black teachers, at 42%, made up the second largest demographic group. Asian and Hispanic teachers made up 1% and 3%, respectively.

In 2009, teacher demographics in our district start to change – the percentage of White teachers begins to grow steadily, and the percentage of Black teachers begins to decrease.

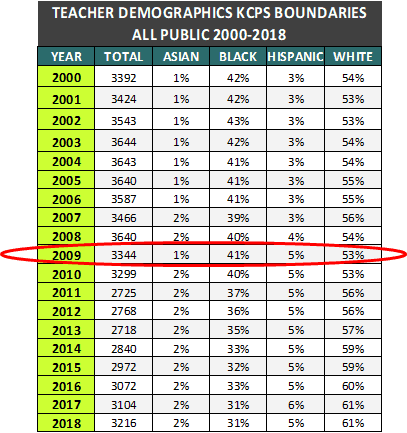
This representation holds more or less steady until 2009, when we begin to see a demographic shift: the percentage of Black teachers starts to decrease, and the percentage of White teachers begins to grow. Overall there is slight growth in the percentage of Hispanic and Asian teachers during this period.

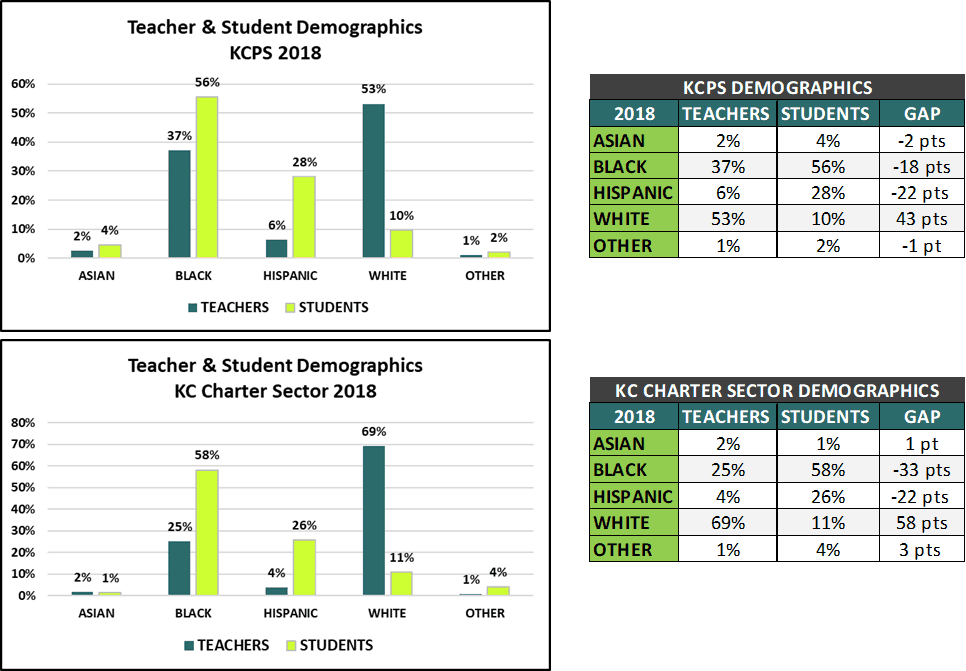
KCPS teacher demographics: 2009-2018

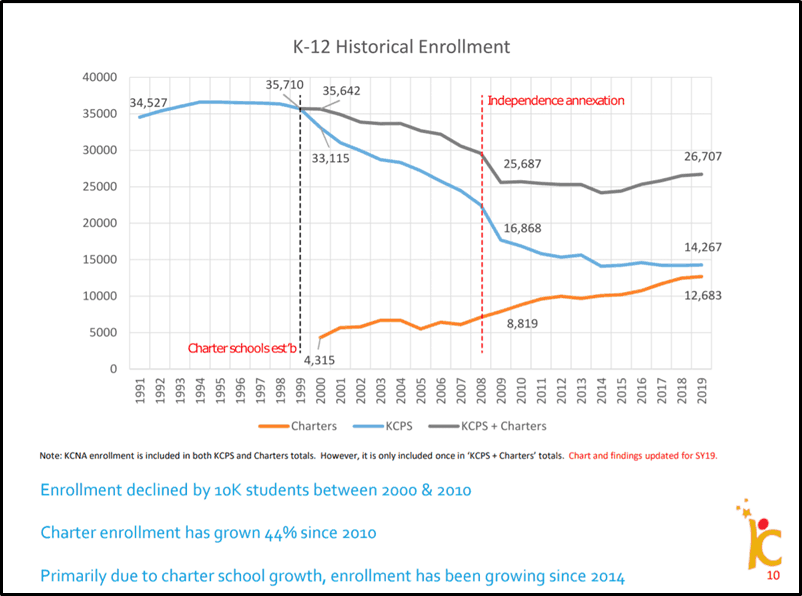
In 2000, 31,327 K-12 students attended KCPS schools. By 2018, enrollment was just 14,221 students – a 55% drop.

The effects of this decline were felt most acutely in 2010, when 26 schools closed under then-Superintendent John Covington’s Right-Sizing plan. Fewer students, and fewer schools, also meant fewer KCPS teachers: between 2009 and 2013, the number of KCPS teachers decreased by more than one-third, from 2519 teachers to 1579.

It’s at this point that the demographics of the KCPS teacher workforce begin to change: the percentage of White teachers starts growing – and Black teacher representation begins to decline in parallel.

The number of black teachers in KCPS schools dropped from 1093 in 2009 to 639 in 2018 – a decrease of 42% (454 black teachers).

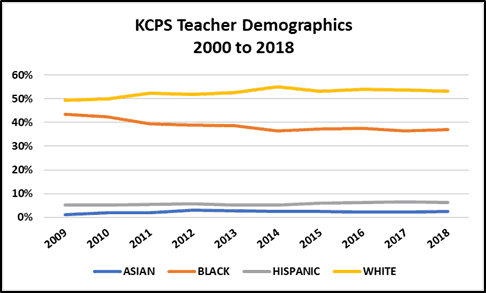
Asian and Hispanic representation during this period is more or less flat.

Between 2009 and 2013, the overall number of KCPS teachers decreased by more than one-third, from 2519 teachers to 1579.

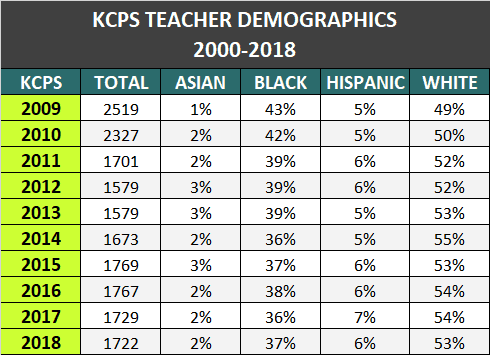
After 2013, as student enrollment begins to steady, the number of KCPS teachers begins to rebound, slowly. But the percentage of Black teachers continues to decrease – by 2018, the number of Black KCPS teachers has dropped by over 40%.

The percentage of Asian and Hispanic teachers remains fairly flat.

Charter Sector teacher demographics 2009-2018

From 2009 to 2018 student enrollment in Kansas City charter schools grew – and with it, the number of teachers employed by charter schools.

K-12 charter enrollment grew more than 50% during this period, from 7,904 in 2009 to 12,305 in 2018. The number of charter school teachers teachers grew by 81%, from 825 to 1494.

In 2009 one of three charter school teachers were black; by 2018, this number decreased to one of four teachers.

But the same overall trends we saw in KCPS apply to the charter sector as well, except this time in an overall context of sector growth.

The number of Hispanic teachers in the charter sector increased from 28 in 2009 to 54 teachers in 2018.

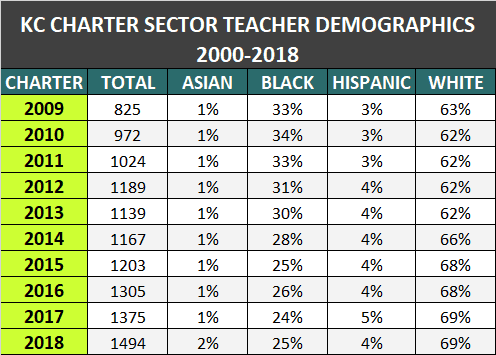
The absolute number of Black teachers increases – there are more Black teachers in charter schools in 2018 (374) than there were in 2009 (272). But this increase doesn’t keep up with overall teacher growth in the sector, resulting in an overall percentage decline: in 2009 one of three charter school teachers was Black; in 2018, only one of four teachers is.

In 2018, only 54 charter school teachers (4%) self-identified as Hispanic; 24 teachers (2%) identified as Asian.

Putting the pieces together

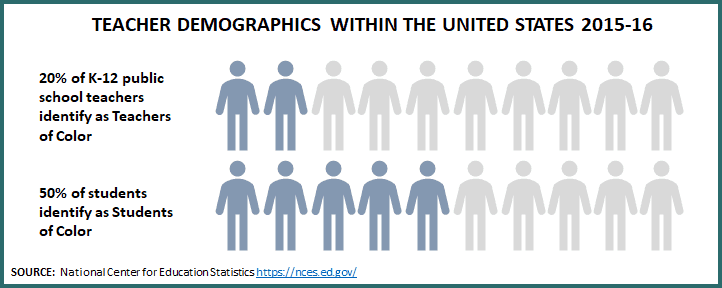
As I wrote in Teacher Demographics Part I, an ever-growing body of research shows that students benefit – socially, emotionally, and academically – from having teachers of their same race and gender.

Within KCPS boundaries, our teaching workforce is becoming increasingly White. The driving force behind this decrease in diversity is the loss of Black teachers in KCPS. This trend continued even after KCPS enrollment steadied, and KCPS teacher employment began to rebound.

As charter enrollment increased during this same period, the number of Black teachers in charter schools grew with it. But it didn’t keep up with overall teacher growth – resulting in a decrease in the percentage of Black teachers.

Finally, the growth of Asian and Hispanic teachers is slight, though important. But when you consider that Hispanic students are the fastest-growing student population in our district you realize the scope of the challenge our schools face in serving this population well, whether from a cultural or language perspective. In 2018 there were more than 7,200 Hispanic students in our public schools – and just 162 Hispanic teachers, both KCPS and charter combined.

I’ve written previously about changing student demographics within KCPS boundaries – you can find this analysis here. You can find a more comprehensive analysis of public school enrollment through 2018 here.

Closing thoughts

The point of this post, and of Set the Schools Free more broadly, is to create awareness of the facts, so we can have more thoughtful and solutions-oriented conversations about the challenges our public schools, both KCPS and charter, face. Building and sustaining a diverse teacher pipeline is one of these challenges.

If you want to learn more about why a diverse teacher pipeline is important, and what that pipeline looks like at the national level, you may find these resources helpful: Why we need a diverse teacher workforce, from the Phi Beta Kappan; The Washington Post: America’s schools are more diverse than ever. But it’s teachers are still mostly white; Diversifying the Classroom: Examining the Teacher Pipeline, from The Urban Institute; and Teacher Diversity, from the National Council for Teacher Quality.

In my last post I included a list of organizations working locally to recruit, develop and retain teachers of color. This list has grown. It includes: Kansas City Plus+The Kansas City Teacher ResidencyThe LatinX Education CollaborativeThe Literacy LabTeach for America KC, the UMKC Institute for Urban Education, AmplifyKC, Brothers Liberating our Communities (The BLOC) and Elements of Education KC.

As always, I welcome your comments, questions, and feedback.

Share

Teacher demographics in Kansas City, Part I: Understanding the representation gap

What do public school teacher demographics look like within KCPS boundaries, and how do they compare to our K-12 student population?

Across the US – and in Kansas City – increasing attention is being paid to the topic of teacher diversity. That’s because an ever-growing body of research shows that students benefit – socially, emotionally, and academically – from having teachers of their same race and gender.

This study validates the idea of “role model effects” of same-race teachers

In a recent study conducted in Tennessee, Black students randomly assigned to a Black teacher in grades K-3 were 7% more likely to graduate from high school and 13% more likely to enroll in college than their peers who weren’t assigned to Black teachers.

In North Carolina, the same study found that for every 10 percentage point increase in Black teachers in a school, the Black male drop-out rate decreased by almost 5% and the intent to go to college increased by 2%. (You can find a summary of this study, and its implications, here).

“Role model effects” are real

The working paper summarized above, “The Long Run Impacts of Same-Race Teachers”, validates an idea that is really just common sense: school teachers are among the very first role models and authority figures in students’ lives. When students have teachers who look like them, it sends a signal early on about their future potential, and what they can be when they grow up.

It also sends a signal about who’s allowed to stand at the front of the classroom and be in charge.   When you consider that, today in the United States, 50% of all public school students are students of color – but that 80% of teachers are White – you realize that most White students receive role model signals throughout their K-12 education. And that many Asian, Black, Hispanic, Indian and other students of color, in contrast, don’t.

This representation gap is just one part of the opportunity gap that students of color face from their earliest years in school. How big is this gap in Kansas City?

Teacher diversity in Kansas City: 2017-18

What do public school teacher demographics look like within KCPS boundaries today, and how do they compare to our K-12 student population?

This post focuses on the 2017-18 school year, the most recent year for which Set the Schools Free has available data.

The majority educators within KCPS boundaries are white.

Of K-12 educators within KCPS boundaries in 2017-18:

  • 2% identified as Asian
  • 31% identified as Black
  • 5% identified as Hispanic
  • 61% identified as White
  • 1% identified as Other

Altogether, 39% of educators identified as Asian, Black, Hispanic or Other; 61% identified as White.

Comparing teacher to student representation

Here’s a comparison between teacher and student demographics for 2017-18, for all public schools within KCPS boundaries.

Black and Hispanic students experience the biggest gap in teacher representation; White students benefit from a representation surplus.

The difference between the percentage of teachers and same-race students is the representation gap. Starting from the left on the bar chart, you can see that representation of Asian teachers and students across all public schools is about the same.

But there’s a noticeable gap between the percentage of Black and Hispanic students in our schools and the percentage of Black and Hispanic teachers. Black students made up 57% of K-12 students within KCPS boundaries; 31% of all teachers were Black. Hispanic students accounted for 27% of all students – but only 5% of teachers.

White students, in contrast, benefited from a representation surplus. White students made up only 10% of all public school students within KCPS boundaries, but the vast majority of teachers – 61% – were White.

Breaking out the data: KCPS and Charter

Does teacher representation look different when broken out between our different public school sectors?

While both KCPS and Kansas City’s charter sector had a similar percentage of both Black and White students in 2017-18, teacher representation differed.

KCPS, in aggregate, had a higher percentage of Black teachers; the charter sector had a higher percentage of White teachers. The gap between Hispanic teachers and students was constant.

Overall, Black educators within KCPS made up a higher percentage of teaching staff (37%) than in Kansas City’s charter sector (25%). In the charter sector there’s a 33-point gap between black teacher and student representation, compared to an 18-point gap in KCPS.

Charter schools, in aggregate, had a higher percentage of White teachers (69%) than did KCPS (53%).

In both KCPS and the charter sector, there was a 22-point gap between the percentage of Hispanic teachers and the percentage of Hispanic students. Hispanic students are the fastest-growing student population within our district boundaries.

Summing it up

The representation gap within KCPS boundaries, in summary

The purpose of this post is to foster a big picture understanding of why educator diversity matters and what teacher demographics look like within KCPS boundaries – including the extent of Kansas City’s representation gap. To facilitate understanding the data presented are in aggregate, at the district-wide and sector level. But it’s important to note that teacher demographics, like student demographics, vary significantly from school to school.

There are several initiatives underway in Kansas City to attract, develop and support teachers and leaders of color for our public schools. They include and/or are led by: Kansas City Plus+, The Kansas City Teacher Residency, The LatinX Education Collaborative, The Literacy Lab, Teach for America KC, the UMKC Institute for Urban Education, and AmplifyKC. Brothers Liberating our Communities (The BLOC) and Elements of Education KC are two others. If you’re aware of other organizations that should be included on this list, please email me or leave a comment below.

There’s been some thoughtful recent coverage about school and educator diversity in Kansas City. If you’re interested in reading more, check out Mara Williams’ KC Star article: There are 100,000 teachers in Missouri. How come only 1% are Black Men? and Elle Moxley’s KCUR story on board diversity: Students in Kansas City’s Classroom are More Diverse, But School Boards Remain Mostly White.

__________________________

Thanks to the Set the Schools Free reader who suggested the idea of looking into teacher demographic data – and sorry it took so long! Teacher demographics in Kansas City Part II, coming soon, will focus on teacher demographic trends over time as well as school-level demographics and representation.

Share

Using student growth as a focal point to understand school quality

Using growth as a focal point, the CREDO Kansas City Study helps bring clarity to an otherwise confusing school quality landscape.

Test scores for the 2018-19 school year will be released soon. They’ll tell us how well Missouri public school students performed on the state assessment (the MO Assessment Program, or MAP) in absolute terms – what percentage of students at each school score proficient or advanced in English, Math, Science and Social Studies in a given year.

What MAP scores won’t tell us, though, is how our schools compare to one another when taking into account the unique student population of each school – race, poverty, gender, language or special ed status.

Nor will they tell us how much students grew academically from one year to the next – or what that growth looks like, by sector and over time, across our district.   

That’s why the CREDO Kansas City Study, released over the summer, is important. But it’s biggest value is in the big picture – not the details.

The CREDO KC study and what it tells us

The Kansas City Study is one of several “City Studies” conducted over the last year by CREDO, an education research organization at Stanford University. The goal of these studies is to provide periodic reports of academic performance in select US cities. The metric CREDO uses to communicate this performance is student growth.

The Kansas City study:

This slide shows average student growth for Kansas City broken out by school sector from 2014-17.
  1. Compares average academic growth of Kansas City students to the state average (Summary: there’s not a significant difference).
  2. Compares average student growth by school sector – Traditional Public, Signature, Charter – compared to the state average (Summary: In English Language Arts (ELA), charter sector growth beats both the state average and Traditional Public Schools (KCPS neighborhood). In most years, these differences are significant. Traditional Public Schools nearly close their significant negative gap with the state over this three-year period. Signature schools, most of which are selective, have similar growth to charters, but this difference is only significant with the state in one year. In Math, overall, sector differences were less significant).
  3. Looks at one year of growth and breaks it out by sector and subgroup, including race, poverty status, English Language Learner status, special education status and gender (Summary: As a sector, Kansas City black charter school students, special ed charter school students, and charter school students living in poverty grew significantly more in ELA, on average, than their state or traditional public school counterparts. There was no significant difference for charter LatinX students or English Language Learners).

In conducting all these comparisons, CREDO uses student-level data and controls for demographics by comparing the average growth of KC students to the growth of similar students across the state.

The CREDO City Studies were funded by Arnold Ventures. You can read CREDO’s Summary of Findings for Kansas City here. You can find a technical description of the study here.

But the real value is in the big picture

Sector averages are useful – but they can mask significant variations in performance between schools.

To facilitate understanding, CREDO translates standard deviations into equivalent days of learning.

That’s why the real value of the CREDO KC study is in the big picture – looking at school performance in both ELA and Math according to just one variable:  student growth.

TAKING A LOOK AT ENGLISH LANGUAGE ARTS

Here’s what school performance looks like in ELA for the 2016-17 school year, broken out by sector:

The charter distribution is the top line; the traditional public is the bottom line. Each dot represents an individual school within that sector according to its average growth during 2016-17.

The center line “0”, in purple, represents the average learning gains of the entire state for one school year.

Each dot represents the average growth of one school: to the right are schools in which students are growing at or beyond the MO state average; to the left are schools in which growth is below the state average.

You can see immediately that there’s considerable overlap between Charters and Traditional Public Schools between -.2 and +.2 standard deviations, clustered around the center line.

After that, my eye goes toward the outliers – those dots standing alone, at either end of the growth continuum. 

On the right:  I’m looking at the six schools (3 KCPS + 3 charter) that are +.2 or more standard deviations from the state average. Students in these six schools are receiving at least 118 days of additional learning compared to their state counterparts. At least three of these schools (those at +.3 standard deviations) are receiving the equivalent of an entire additional year of learning or more.

Students in growth-positive schools grew more than the state average. Students in schools at +.2 standard deviations benefited from an additional 118 days of learning (or more). For these students, the ELA proficiency gap is closing.

When I look at these very growth-positive schools I want to know how they’re achieving this level of growth – and what we might learn from them. I wonder whether or not they’re growing to accommodate additional students, or if they plan to replicate.

I also wonder if and how these schools are communicating this growth to prospective families – because I’m guessing that some of these schools, despite their success, have empty seats.

On the left:  I see about six schools (2 KCPS + 4 charter) that are more than -.2 standard deviations below the state average. Average growth for these schools is at least 118 days less than the state average.

Students in growth-negative schools grew less than the state average. Students in schools at -.2 standard deviations lost at least 118 days of learning – and in some cases, much more. For these students, the ELA proficiency gap is growing.

For the three schools (2 KCPS + 1 charter) that are more than (-.4) standard deviations from the center line, students finished the year in Spring 2017 farther behind than where they started in the previous Fall.

When viewed through this growth lens, the case for closing (or re-starting) these schools becomes pretty clear.

When I look at these very growth-negative schools I wonder if they’re still operating (since 2017 our school landscape has changed: three charter schools have closed, and two charters are currently in the midst of turn-around).

For those still operating, I wonder what’s being done, either by KCPS or their charter sponsor, to either re-start or close them.

And I wonder if parents and guardians of students who attend those schools, irrespective of school sector, have any idea that their child is attending a failing school. I’m guessing that most of them don’t.

CURIOUS ABOUT MATH PERFORMANCE?

Here’s what school performance looks like in Math for the 2016-17 school year, broken out by sector.

For math, the growth distribution is more spread out.

The overall distribution looks a bit different than ELA – there are more growth-negative and positive schools on the two ends of the performance continuum.

Closing thoughts

School quality in Kansas City isn’t a KCPS or charter problem – it’s a shared challenge. Student growth provides a focal point to evaluate school performance in a more objective, data-driven and sector-neutral way.

Our district is small – altogether just ~27,000 students attend around 70 schools. What would public education in our city look like going forward if we reached a consensus that low-performing schools, regardless of sector, shouldn’t operate indefinitely – and we focused our energies on both ends of the performance continuum: closing and re-starting schools on the far left, and incubating, growing and replicating those schools on the right?

This shift to the right doesn’t happen by accident.

If we pursue this strategy systematically, we could dramatically change Kansas City’s school quality landscape in a matter of years. In the process, we could also increase efficiency.

And if we’re intentional, coordinated, and transparent in conducting this work, these changes can happen in a way that respects students, families and educators – and provides adequate support both to schools and their communities.

Share

The case against efficiency (and what we should be talking about instead)

When we talk about public education in Kansas City, efficiency matters. But the more important conversation is about school quality, and where decisions affecting students are made.

In late 2018 KCPS began sharing an analysis of public education within KCPS boundaries. The Kansas City Public Education System Analysis is a comprehensive study that reviews the current state of public education within KCPS boundaries, along with accompanying trend data.  

The KCPS Kansas City Public Education System Analysis is helping advance the conversation about public education within KCPS boundaries

Set the Schools Free believes that if we can build consensus around an objective set of facts, we can have a different, and more productive, conversation about the future of public education within KCPS boundaries.

By making the District’s understanding of the facts publicly available, and initiating a community conversation about these facts, the KCPS System Analysis makes a significant contribution to this end.  

So what does the analysis say?

There’s a lot of data, and it can be hard to make sense of it all. In summary, though, we have a lot of schools. Too many are too segregated. And too few are high-performing.

But the story we tell to explain why, in 2019, our district looks the way it does matters as much as the numbers. And the loudest story I’m hearing is one of inefficiency and empty seats created by too many public charter schools.

This inefficiency narrative is problematic for three reasons:

We have more schools than Springfield, MO – a district of similar size (p. 16)
  1. It misses the point of school choice. Efficiency alone doesn’t lead to better student outcomes. The point of school choice, and public charter schools, is to improve access to quality schools for students who, by virtue of where they live or socioeconomic status, lack quality school options. As long as we have students sitting in chronically low-performing schools, we need new school options.  

  2. It overlooks our traditional school district’s role in the proliferation of choice. Charter schools first opened in 1999 as a response to chronically low-performing KCPS schools. Two decades later, in 2019, there are still chronically low-performing KCPS schools. (And, yes, we now have some low-performing charter schools, too).

  3. It ignores what charter growth over the past two decades is actually telling us. At 47% of all K-12 public enrollment, Kansas City has one of the highest charter market shares in the country. Families are voting with their feet, and many are choosing charter schools. Why? Conversations about efficiency don’t help us answer this question – and they don’t help KCPS become more competitive as an operator of public schools.

So what’s the conversation we should be having instead?

It’s a conversation about school quality…

This isn’t an efficiency conversation, or even a district-charter conversation. It’s, first and foremost, a school quality conversation.

There are more seats than students (p.70)

25% of students within KCPS boundaries (7500) are in public schools that rank in the bottom five percent in Missouri in reading and math. These seats are in both district and charter schools.

We need to be honest:  an open seat in a low-performing, half-empty school – whether KCPS or charter – is probably not a seat most parents want for their child.

So it’s not the decision to start new schools that’s creating too many seats. To the contrary – we have a responsibility to try new approaches and create new school options when quality options are lacking.

Half of all seats are fully accredited (p. 74)

Rather, it’s our inability to admit, first, that we have chronically under-performing schools – and, then, our unwillingness to either close them, or initiate school turnarounds -that creates a seat surplus.

A good starting point for kicking off this school quality conversation would be to develop district-charter consensus that low-performing schools – irrespective of school type – should not be allowed to operate indefinitely.

We need to hold all public schools, KCPS + charter, accountable at the school level in a fair, transparent and objective way. 

It’s also a conversation about where decisions are made

Growing charter enrollment is driving overall growth in public school enrollment in Kansas City. What are charter schools doing differently and/or better than traditional public schools that may be contributing to the sector’s growth?

47% of all public school students attend charter schools (p.10)

Ideology aside, the most important difference between charters and most traditional public schools is where decisions affecting students are made.

In charters, decisions about a school’s most important resources – staffing, budget, time, and curriculum – are made at the school level, closest to students.  This is in contrast to a traditional school district where decisionmaking is centralized to maximize efficiencies and economies of scale, which inevitably results in a more “one-size-fits-most” approach to operating schools.  

The benefits of school-level decisionmaking

School-level decisionmaking brings a couple of different benefits. It reduces the distance between school leadership and the students and communities they serve, making schools more agile and responsive. It builds a sense of ownership, and encourages different approaches to running schools.

It also helps attract and foster more entrepreneurial talent. And because it’s clearer where decisions are being made, and who’s responsible for those decisions, it helps promote greater accountability. These are all tangible benefits that families experience directly.

If we’re focused solely on efficiency we’re not asking the question:  What can our traditional public schools learn from this different model of organizing and operating schools? 

Note: Shifting decision-making to the school level does not, on its own, guarantee school success. This is why accountability matters.  

Choice is messy – but necessary

Is this school-centered approach the most efficient way to run a system of schools? No, it’s not. But there’s no point to efficiency when it’s not producing the outcomes you want. There’s nothing efficient about schools that lose enrollment year after year, or students who graduate without the skills they need to succeed in life.

The reality is that choice, whether in the public or private marketplace, solves some problems but creates others. It can be messy and time-consuming. And without robust infrastructure to support it, choice can produce inequity, further deepening racial and economic divides.  That’s why the work to make Kansas City a more equitable, and accessible, public school marketplace is so urgent.

Do we need more coordination, collaboration and innovation, both between and among KCPS and charter schools, to build trust and maximize dollars going into classroom? Absolutely. But we should be realistic: a choice-based system will never be as cost-efficient as a traditional school system, where one entity – the traditional public school district – operates all public schools, makes all key decisions, and assigns students to schools based on where they live. 

Closing thoughts

KCPS and Superintendent Mark Bedell deserve a lot of credit for undertaking a comprehensive systems analysis, and for initiating a community conversation about the future of public education in our district.

But in having this conversation, let’s not lose the forest for the trees. Efficiency is important. But the cost of failing schools is ultimately much higher than any inefficiencies school choice brings with it. Let’s re-focus the conversation on school quality, and on how we can work together to build a system that is more responsive, and accountable, to the students it serves.

Share

A very brief overview of public education in KCMO

How did Kansas City become a city of 14 school districts and 21 public charter schools? Set the Schools Free crossed the KCPS border to find out….

Earlier this week, I participated in Turn the Page KC’s 2019 School Suspension Data Summit. This Summit was a day-long gathering of Kansas City community stakeholders, parents, students and school teams to raise awareness of lost instructional time, what local data tells us about the disparity in school suspensions by race and gender, and the correlation to chronic absenteeism. Click here to read more about the Summit, and to access the city-wide suspension data prepared by Dr. Eric Camburn at UMKC’s Urban Education Research Center.

According to Turn the Page, Missouri is one of 11 states that reported larger gaps than the national average between the suspension rates of black students and white students for both boys and girls. In 2015, one in four black male K-3 students in the City of Kansas City were suspended from school – and the overall number of suspensions in KCMO has actually gone up over the last four years. The point of the Summit was to move the conversation beyond “OK, we have a problem” to begin examining the underlying causes of this problem. Why is this happening? And what can we do about it?

An abbreviated history of how KC came to be a city of 14 school districts + 21 public charter school operators

One of the challenges with talking about public education in Kansas City, of course, is that we don’t have just one school district, we have 14. Those 14 districts straddle four different counties. And one of those districts – KCPS – also has 21 different public charter school operators.  Each of these districts and schools serve different student populations, and have their own unique challenges.

The above presentation provides a very short overview of how we came to be a city of 14 different school districts, and the different forces (namely, race + economy) that have shaped our landscape over the last 70 years. And it also, I think, provides a bit of context and insight to both the opportunities and inherent difficulties involved with city-wide approaches to supporting public education in Kansas City.

Share

KC Public School Enrollment Dashboard – now with 2018-19 data

By making public education data accessible and meaningful, Set the Schools Free is helping build a culture of information, inquiry and accountability in Kansas City’s public education sector. Promoting greater transparency around school enrollment data is an important part of building this culture.

The KC Public School Enrollment Dashboard now includes 2018-19 enrollment data for all public schools within KCPS boundaries. It also includes updated median income data from the American Community Survey for all zip codes.  

With three full years of zip-code based enrollment data, the dashboard is getting more and more useful. (You can toggle between years using the blue buttons in the top right corner). Keep reading and you’ll find an interesting profile of 64130 I put together, using the dashboard. You’ll also find a handy chart and accompanying map that lays out enrollment growth and loss over the last three years, by zip!

The KC Public School Enrollment Dashboard brings transparency to enrollment data.

For those who aren’t familiar with the dashboard, it’s a great reference tool to understand the full universe of public schools operating within KCPS boundaries; the breakout of KCPS and charter enrollment, overall, between grade segments, and by zip; and median income across our district.

Most simply, clicking on an individual school (or group of schools) enables you to see where that school is located; the number of students it serves, and from what zip codes; and the median income of those zip codes.

Or, you can click on a zip code to understand how many students live in that zip, the schools that students in that zip code attend, and the overall KCPS-charter break-out.

Here’s an example of what I learned about 64130, the KCPS zip code with the most public school students, by clicking through the dashboard:

3,954 of 26,741 total students -14% of all public school students within KCPS boundaries – reside in the 64130 zip code, which has a median income of $37,4146 (to put this in context, a family of 4 earning less than $47,435 is eligible for reduced-price lunches, and less than $32,630 is free-lunch eligible).

14% of all public school students in our district reside in 64130. Half of those students are K-5.

In grades K-5 and 6-8, a majority of 64130 students attend public charters. In high school, a majority of students attend KCPS schools. Overall, half of all students residing in 64130 attend KCPS schools.

Public school enrollment across the district has grown by 891 students since 2016-17, so I was also curious to see where that growth was coming from: which zip codes were adding students?

64127 added the most students between 2017 and 2019; 64113 had the highest percentage growth in enrollment (of zips with previously enrolled students).

By comparing enrollment data by zip across the last three years (I copied and pasted the zip data from each year on the dashboard, then re-arranged it to facilitate analysis) I learned that 64127 (median income: $31,174), was the fastest growing zip code in terms of student enrollment. From 2017 to 2019, 64127 enrollment grew by 223 students (6%).

On a percentage basis, 64113 (median income: $146,406), grew the most, with the addition of 80 students (27%).

And 64132 (median income: $32,203) had the biggest net loss of students. 64132 enrollment shrank by 94 students, or by -5% overall.

The main point? You can use this dashboard in a number of ways to answer questions you might have. Which zip codes have the highest concentrations of KCPS students? Or the most K-5 students? Or, where do middle school students in a particular zip end up going to high school? Just click “clear all filters” to begin a new inquiry.

I’d love to hear what you’re most curious about, and what questions you’re trying to answer. Feel free to leave a comment, or send me an email.

________________

Finally, you’ll notice a few differences between this year and last year’s enrollment data. The number of students enrolled grew (again!) and the overall school count (72) is higher than last year’s (69).  Here’s why:

  • Benjamin Banneker Charter Academy closed at the end of 2018, so is not included in 2018-19 data
  • Academie Lafayette (AL) added a new building at Armour Blvd. AL grades 6-8 are now at Armour; the AL Cherry and Oak Campuses are now both K-5 schools (previously they were split Grades K-3 and 4-8)
  • Allen Village Charter School now shows up as four individual schools (it previously showed up as a K-8 and a 9-12). These are: Allen Village Primary (K-2), Elementary (3-5), Junior (6-8), and High School (9-12).
  • Finally, Lincoln College Academy Middle School (KCPS) now shows up as its own school – grades 6-8 were previously bundled with Lincoln Prep High School

If you’re looking for a quick and easy-to-understand overview of our district, this Set the Schools Free one-page summary is still your best resource.

Share

KCPS Board Elections: A School-Level Primer

With KCPS board elections upcoming, Set the Schools Free wants to shift the focus from KCPS “the system” to KCPS “the schools.”  Only 1 of 5 KCPS third-graders reads on grade level. What can the the incoming board do to address this problem?

Only one of five KCPS third-graders reads on grade level

Last week I attended a Kansas City Public Schools candidate forum hosted by Show Me KC Schools. Issues like Pre-K, tax abatements, good board governance, and community partnerships were discussed. There was excitement about the district’s recent APR score of 82.9. The candidates expressed their support for Dr. Bedell, and the progress KCPS has made under his leadership.

Someone asked what KCPS would do to shut down low-performing charter schools. But, otherwise, there was little talk of KCPS schools or student achievement within KCPS.

Is it the system, or the schools?

We hear a lot about “the system” when we talk about public education in Kansas City. That generally means KCPS, our traditional public school system. With +32 schools educating ~14,300 students, KCPS is the largest operator of public schools in our district.

(For an overview of public education in our district, click here).

Public school systems exist for a reason.  They provide coherence, and a means of organizing the important work of educating children. They create efficiencies and economies of scale where they wouldn’t otherwise exist. They develop policies that protect the interests of schools and students, and provide a sense of community and identity.

But “systems” don’t educate students. Schools do. And most of us have no idea how well our individual schools are actually meeting the needs of the students they serve.

Whether you’re a parent, school board member, non-profit leader or policymaker, you can’t fulfill your responsibilities – making informed decisions, asking the right questions, designing thoughtful programs, holding schools accountable, or advocating on students’ behalf – if you don’t understand how well schools are serving students.

So let’s shift the focus to schools

The 82.9% APR tells us that KCPS has finally achieved a certain level of system-level stability. With just a few weeks until the election and only three of seven seats being contested (1, 4, & 5), I don’t actually think there’s much opportunity to influence the debate in a substantive way.   

Only 3 of 7 seats are being contested in the upcoming board election: sub-districts 1, 4 & 5.

But I do think there’s an opportunity for influencing the new board, when it’s installed in April, to shift the focus from KCPS “the system” to KCPS “the schools.”

This means starting to look beyond system-level metrics and holding the administration accountable for academic performance at the school-level in a meaningful way.

Because, really, a school system can’t be any better than the schools that make it up.

It’s easy to get lost in the data, so I’ve picked a simple yet powerful metric to help focus our attention on school-level performance:  third-grade reading proficiency.

Third-grade reading as a focal point

Third grade is “a pivot year,” a year when students transition from “learning to read to reading to learn.” Students who don’t read proficiently by third grade are four times more likely than proficient readers to leave high school without a diploma. For Black and Latino students growing up in poverty who aren’t proficient, this number doubles:  they are eight times more likely than their more affluent peers to drop out of high school or not graduate on time.

Third-grade reading proficiency is also predictive of health outcomes and life expectancy. People with low literacy skills are less likely to become employed, make living wages, and enjoy long healthy lives. Increasing the percentage of third graders reading on grade level is a goal of Kansas City Community Health Improvement Plan (CHIP)

For all of these reasons, Mayor James launched the city-wide Turn the Page KC third-grade reading initiative shortly after taking office in 2011.

The main point? Third-grade reading is foundational. Low third-grade literacy effectively puts a ceiling on what our schools are able to achieve academically: those same third-graders who can’t read in third-grade continue onto fourth grade, and then fifth, and sixth…..they don’t magically show up the next year knowing how to read.

It’s in the plan

Conveniently, improving third-grade reading proficiency is included in Goal 1 of the 2018-2023 KCPS Strategic Plan.

Improving third-grade reading proficiency is the first goal of the 2018-2023 KCPS Strategic Plan.

But over the last three years, overall reading proficiency, as measured by the gap between the state average and KCPS proficiency, has remained about the same.

Due to changes in the MAP test in recent years, the only way to understand academic performance over time is to compare the gap between district performance and the state average.

With a 30% gap between KCPS and the state average in 2017-2018, the district missed its first year performance target of 25% for closing the gap with the state by five percentage points.

What does third-grade reading look like across KCPS “the system?”

In 2017-18, only 18% of KCPS third-graders – 235 of 1316 students – read at a proficient or advanced level. This is compared to the MO state average of 48.6%.

The majority of third-graders (55%) were Below Basic.

55% of KCPS third-graders read at a Below Basic level.

(Note: In 2017-2018, English Language Learners comprised about one-third of all 3rd grade students who took the MAP test. But even accounting for those third-graders, the overall distribution remains the same – the majority of KCPS third-graders read at a Below Basic Level).

There is a significant disparity in reading proficiency across racial and ethnic groups. Black students make up the majority of KCPS third-graders, 57%, but only 35% of proficient and advanced readers. Only one in 10 black students is proficient or advanced, compared to roughly one in four white students.

There is a significant disparity in reading proficiency across racial and ethnic groups.

Two of 10 Hispanic students are proficient or advanced; Hispanic students make up 26% of all proficient third-grade students. This number is encouraging.

These system-level figures show us we have a problem. But “the system” doesn’t teach students to read, schools do.

What does third-grade reading look like across KCPS “the schools?”

Two-thirds of KCPS elementary schools – 16 of 24 schools – have third-grade reading proficiency rates below 20%.  

Two-thirds of KCPS elementary schools have proficiency rates below 20%. At these 16 schools, fewer than 1 of 5 students reads on grade level.

Proficiency ranges from 3% (Troost Elementary) to 53% (Border Star Elementary, a signature school).  For reference, these two schools are 1.5 miles from one another – a five-minute drive by car.

At this point, you might be thinking: “KCPS serves a high poverty student population. Student mobility – the movement of students between schools during the school year – is also high. Of course reading proficiency is low.”

But if we’re not teaching our elementary school students to read, then what are we teaching them?

And when you actually look at third-grade reading proficiency next to school mobility data, you see that mobility explains some, but not most, of student proficiency. There’s a significant amount of variation between schools.

The above graph shows that we have schools with low mobility and low proficiency. We also have schools with high mobility, and higher proficiency. One important question: what accounts for the different outcomes at these different schools?

Know the facts – and ask the right questions

So is it the system or the schools?

Both are important. But in the rock, paper, scissors of public education, schools and students beat system every time. We need to shift the focus from “the system” to “the schools.” Third-grade reading proficiency gives us a useful metric to do that.

To support the new board in its oversight role, Set the Schools Free has put together a brief powerpoint with key statistics on third-grade literacy in KCPS. To better acquaint candidates and voters with third-grade literacy in their sub-districts, this Primer includes a list of KCPS elementary schools by sub-district, with proficiency percentages and overall sub-district averages.

Click on the above image to access the Powerpoint Primer

I’ve also put together a few questions to help kick off the conversation about third-grade reading proficiency:

  1. What is the district’s third grade K-3 literacy strategy? How does implementation differ from school to school?
  2. How is reading assessment data used to inform school-level strategy and the allocation of resources across schools?
  3. What does the allocation of literacy resources across schools actually look like, compared to need? How can we fill the gap?
  4. Could K-2 classrooms be organized differently to better support early literacy?  For example, putting two teachers in the highest-needs classrooms to ensure more individual student support?
  5. Below basic students make up the majority (55%) of third-grade readers. What happens to these students when they reach the fourth grade?

Set the Schools Free believes that the state of third-grade reading in our school district is important enough to dedicate several KCPS board workshops to this topic.

But at the very least, it’s my hope that, as the final candidate forums wind down and the new KCPS board is seated, board members take this issue to heart.

The new board should request that progress in third-grade reading be incorporated as a standard school-level metric in the monthly superintendent’s report. Just as financial reserves are significant of the district’s overall financial health, progress in third-grade reading is significant of the district’s academic health. There’s a way to do this, I’m sure, that would maintain the urgency around this conversation, keep it meaningful and forward-looking, and prevent it from becoming rote.

And finally, board members can become reading mentors in their local public school (and community members should do this, too!). Visit leadtoreadkc.org and volunteer to spend one lunch hour, once a week, reading with a student.

As a system, KCPS has made significant strides over the last several years.
Enrollment has steadied, and started to grow. Accreditation is on the horizon. There’s increasing momentum around district-charter partnerships.  We have a superintendent who has the community’s confidence, and who wants to be held accountable.

Let’s help him help KCPS schools by knowing the facts, and asking the right questions.

___________________________

Note: Because this is a KCPS board election primer, it’s focused exclusively on KCPS and KCPS schools. Set the Schools Free promises to share the same information about third-grade literacy in Kansas City’s charter sector in the next post.

Share

An overview of the KC school district (and a call for ideas)

Public school enrollment grew for the 5th year in a row; 47% of all public school students now attend charter schools; and 1 of 4 third-graders within district boundaries is reading on grade level. KCPS school board elections are coming up in April. What do *you* think the main issues are?

Last month DESE released enrollment data for the 2018-19 school year. Overall public school enrollment grew for the 5th year in a row, to 26,762 K-12 students. KCPS grew by 66 students; the charter sector grew by 170. While charter growth slowed compared to previous years, it’s still notable given the closure of Benjamin Banneker Charter Academy, a 320- seat charter school, last summer. 47% of all public school students within our district boundaries now attend public charter schools.

I’ve updated this one-page overview of Public Education within KCPS Boundaries to reflect the recently released enrollment and demographic data. I’ve also included the updated 3rd grade reading data (more on that in future posts) and a few important facts about public education within KCPS boundaries.

Click here to access the one-pager. Select “landscape” lay-out to print.

Following on last month’s post about finding a replacement for FRL – this year I’m using the “At-Risk” designation as a proxy for student need instead of the more traditional Free & Reduced Lunch percentage. “At-Risk” is the percentage of students who are directly certified as being beneficiaries of SNAP, TANF, or who are homeless, unaccompanied, migrant or in foster care.

(I’m using the “At-Risk” label instead of “direct certification percentage” because 1) I’ve seen other school districts use it; 2) it’s more descriptive; and 3) it’s shorter!)

The “At-Risk” designation signifies a higher level of poverty than FRL eligibility. It’s not a perfect measure, and it doesn’t capture the full spectrum of need (for this reason a multiplier of 1.6 is used to approximate a school’s total low-income student population). But at this point it’s more accurate than FRL data, which over 75% of schools within KCPS boundaries no longer collect; the FRL data for some of our schools is now five years old.

Your input, please – upcoming KCPS board elections

Elections for the KCPS school board, scheduled for April 2, 2019, are in less than two months. As a result of a 2013 state mandate, the number of board seats will shrink from nine to seven, sub-districts have been re-drawn, and all seats will be up for election. If you want to learn more about why this is happening, KCUR has some good coverage you can find here.

It goes without saying (hopefully) that Set the Schools Free believes all candidates, irrespective of their political affiliations or ideologies, should have a good command of the facts. To that end, I’m in the process of putting together a short election primer for candidates and voters, to help inform the debate.

But to inform MY thinking I really want to know what YOU think the key issues are. What do school board candidates need to know? What are the key issues facing our district going forward? What are your biggest concerns as a new board is installed?  Where do you see the biggest opportunities?

Leave a comment below or, if you prefer, send me an email. I’d love to hear from you.

Share

Finding a replacement for FRL to measure poverty in KC schools

75% of public schools within KCPS boundaries no longer collect FRL data due to participation in the Community Eligibility Provision, part of the National School Lunch Program. Direct certification data offers a reasonable alternative to FRL for measuring socioeconomic need at the school level. We should use it.

Good news! The School-Level Diversity Data Tool, launched just last month, now includes 2016-17 socioeconomic data. Previously it included only Race/Ethnicity, Individualized Education Plans (IEP/ Special Education) and English Language Learners (ELL).

I’ve added two different columns of socioeconomic data. The first column, Free and Reduced Lunch (FRL), is pretty straightforward. It’s the percentage of students at each school who qualify to receive free or reduced price lunches under federal income guidelines. A family of four is eligible for reduced-price lunch if they make under $44,955/year; for free lunch if they make under $31,590. (About 90% of students in our public schools are FRL eligible).

Now featuring FRL and Direct Certification data!

Until recently, FRL has been the measure used most widely to understand economic disadvantage at the school level. But because of federal-level policy and administrative changes to the National School Lunch Program, FRL is losing its usefulness as a measure for assessing individual student-level poverty.   

For that reason, I’ve added a second column of data that’s increasingly being used as an alternative to FRL:  the direct certification percentage.

Why is FRL no longer reliable?   

In the past several years a growing number of public schools in our district have begun participating in the Community Eligibility Provision, a federal program that allows high poverty schools and school districts to serve breakfast and lunch at no cost to all students.

CEP reduces the stigma associated with receiving free or reduced prices lunches. It relieves administrative burden both on families, who no longer have to fill out applications to participate in the Free & Reduced Lunch Program, and on schools, who no longer have to collect and process individual household applications to get reimbursed. It also makes food service more efficient by removing cash from the meal transaction.

These are wins for students, families and schools.

CEP schools no longer report FRL data

But because CEP schools are no longer collecting household applications, they no longer report FRL data. For example, if you look at DESE 2016-17 Building-level Demographic Data for public schools within KCPS boundaries, you’ll see a lot of schools – like Hope Leadership Academy, a charter, or Rogers Elementary, a KCPS school– that have “zero percent” FRL. These are CEP schools.

(For CEP schools that don’t have 2016-17 FRL data, I’ve pulled data from the most recent year available. This is the same technique I used with the Analysis of student demographics within KCPS boundaries from April 2018).

Losing accurate FRL data is problematic because it’s our primary means for understanding student economic disadvantage at the school level. Without it, we don’t have a reliable proxy for poverty in CEP schools.

And if we describe CEP schools as 100% FRL – because all students now receive free meals – it means we’re over-representing the number of economically disadvantaged students in participating schools. We lose understanding of the different contexts in which different schools operate. And we have no way of comparing, for accountability purposes, the academic achievement of higher needs students compared to their more economically advantaged classmates.

Direct certification as a potential replacement for FRL

Rather than collecting paperwork, CEP schools are now able to “directly certify” student eligibility for free and reduced-price lunches by cross-checking, via database, whether families and caregivers of students participate in state-administered, means-tested programs such as SNAP and TANF; or whether students are unaccompanied, migrant, homeless, or in the foster care system. This number of direct certification “matches” provides the basis for CEP school lunch reimbursements.

And it’s this number of “directly certified” students that’s being used, increasingly, as an alternative to FRL for understanding poverty at the school level.  

Atlanta Public Schools are including direct certification data in their school profiles . Thomasville Heights is the APS partnership school I wrote about in October 2018.

In conducting research on Atlanta Public Schools’ partnership schools, for example, I noticed that Atlanta Public Schools includes the percentage of directly certified students, rather than FRL, in the individual school profiles of their Charter and Partner School Annual Report. Washington, DC is now using direct certification data to identify its at-risk student population in its new STAR school accountability system. According to a recent Brookings Institution Policy Brief, a number of other states are following suit.

The Community Eligibility Provision and Direct Certification in Kansas City

The Community Eligibility Provision rolled out nationally in 2014-15.  As school participation in CEP grows it becomes increasingly important to find a reliable replacement for FRL. I’ve included direct certification data in the diversity tool, along with FRL, to help build awareness in Kansas City.

(Note:  The percentage of directly certified students for each school is also called the Identified Student Percentage (ISP), which is how it shows up on DESE CEP spreadsheets.

As of 2016-17, the last year for which a complete set of demographic data is available, about 75% of public schools within the KCPS footprint were participating in CEP. This number includes 100% of KCPS schools and slightly more than half of all charter schools. Several charters were CEP-eligible (have a Direct Certification/ISP of 40% or greater) but were not yet participating; others are near-eligible.

While this level of participation is great for our students and schools, it means we no longer have FRL data for at least 3/4 of our schools.

We do, however, have a complete set of direct certification data!

A few closing thoughts  

Using Direct Certification/Identified Student Percentage as a proxy for economic disadvantage at the school level isn’t without limitations. These include:

  • Data accuracy depends on the strength of the state’s direct certification matching process, as well as the administrative capacity of implementing schools (charter schools, for example, may face particular challenges due to lack of capacity).
  • Direct certification doesn’t capture the full universe of student need – students who would be eligible for reduced lunch, but not for SNAP, for example. (For this reason, states use a multiplier of 1.6 to determine school eligibility for lunch reimbursement).
  • It doesn’t capture families who may be eligible for SNAP or TANF but aren’t participating in these programs. For example, direct certification will under-report student poverty at schools with higher numbers of undocumented immigrants.

The bottom line, though, is that FRL is no longer enough to quantify student need at the school level. We need something more precise.

Direct Certification/Identified Student Percentage may or may not be the long-term fix to replace FRL, either nationally or for the state of Missouri. But in the meantime these publicly available data give us important, more recent, and slightly more nuanced socioeconomic information about the students our schools are serving. We should use it.

________________________

This post represents my best attempt at explaining a pretty significant national policy change and what it means for us locally;
it’s new territory for Set the Schools Free. If you have other useful information or ideas to contribute to the conversation, please leave a comment below – I’d love to hear from you.

And now a Public Service Announcement…

Is your school taking advantage of CEP? If you’re not sure, you should check. Under federal law, states are required to post, on an annual basis, a list of schools that are CEP eligible or near-eligible.  You can find this information for the state of Missouri here. Note that just because a school is CEP-eligible doesn’t mean it automatically participates in the program.

(For schools that are *not* CEP near-eligible and don’t show up on the list, data in the diversity sorting tool comes directly from DESE).

If your school, or a school you serve, has a lower direct certification percentage than you expect, it’s worth looking into why that is. It’s possible that families and caregivers aren’t taking advantage of programs for which they’re eligible. Or, that your school needs to improve its administrative processes supporting direct certification. Happily, with some effort, these challenges can be addressed.

Here are a few additional resources if you’re interested in learning more:

Share

The gift of school-level diversity data, KCPS boundaries

This holiday season Set the Schools Free brings you some handy reference documents on school-level diversity within our district boundaries, plus a dynamic table to help you sort through the numbers yourself.

One of my core beliefs in writing Set the Schools Free is that building consensus around an objective set of facts will allow us to have more productive, solutions-oriented conversations about the challenges facing our public schools. 

Some data in your stocking

Earlier this Fall I participated in a Midwest convening of the Diverse Charter Schools Coalition, a national coalition of schools that have racially, culturally, and socioeconomically diverse student populations. DCSC helps create diverse public charters through research, advocacy and outreach. Citizens of the World Kansas City is a DCSC member.

In preparation for the gathering I put together an overview of student diversity in Kansas City’s charter school sector to share with participants. The document was useful, so I wanted to share the overview – which now includes KCPS schools, and is taken from publicly available data from DESE – with you.  As we talk about race, equity, and diversity across our school district, I think we all benefit from more access to accurate school-level information.

Happy Holidays!

To learn more about the demographic trends in our public schools over the last decade see my earlier posts on Student Demographics within KCPS Boundaries.  In summary, African American enrollment has declined significantly; enrollment of Hispanic, Multi-Racial and White students is growing; overall public school enrollment has grown for the last four years.  Most of this enrollment growth is occurring in our charter sector.

What does diversity look like in our city?

And how does it compare to our public schools?  The slide below compares race and ethnicity of the general population of Kansas City as a whole to the general population of our school district – and then to our population of public school students. The general population data are from the 2012-2016 American Community Survey, which I retrieved from the very useful “Area Profiles” of Kansas City and the Kansas City School District, compiled by KCMO’s City Planning and Development Department. 

Click to see an enlarged version

The pie charts show pretty clearly that our public schools don’t reflect the make-up of either our district population overall, or of our larger city. The representation of African-American and Hispanic students in our public schools is disproportionate to the general population. White residents make up the biggest population group within our city, and within the footprint of our school district – but, as of 2016-17, only 10% of all public school students within KCPS boundaries.  

What does diversity look like in our schools?

These slides provide school-level demographic data (race/ethnicity + ELL and IEP data) for 2016-17, the last year for which it’s available. The first are KCPS schools, sorted by size. The second are charter schools, again sorted by size. These are meant to be general reference documents. 

Click to see an enlarged version

It’s hard to understand patterns or trends, though, without the ability to manipulate the data.

A tool to help you make sense of it all

Set the Schools Free has developed a simple tool that allows you to sort demographic data at the school level. This dynamic table allows you to look at all public schools together, or isolate just KCPS or charter schools. Then you can sort schools by any one of the columns. You can also compare different schools to one another by clicking on individual schools and then  “compare.”  

Click to access this sorting tool

In a district in which the majority of students are African American and Hispanic, the majority of our schools – 55 of 69, or almost 80% — are predominantly African American or Hispanic. Most schools in our district serve at least some white students, though white students are most heavily concentrated in a handful of schools of choice – mostly charter schools. On a percentage basis, the schools serving the highest percentage of White, Hispanic, African American and ELL students tend to be charters. KCPS neighborhood schools serve a higher percentage of IEP students. 

One of my biggest take-aways from sorting through the data was that some of my assumptions about school-level diversity in our district were simply wrong; a number of our schools are more diverse than I realized. I thought this was encouraging. 

I’m curious to hear what you see when you look at the data. What do you find most surprising? Email me or leave a comment below, I’d love to hear from you. 

______________________________________

Note:  Because of the Community Eligibility Provision (CEP), a program in which schools with a high percentage of students eligible for Free & Reduced Lunch (FRL) can forgo the paperwork and extend free lunch to their entire student population, most public schools in our district are no longer collecting or reporting FRL data. Socioeconomic status is obviously a really important part of school diversity; I hope to be able to include this information within the coming months. 


Share