75% of public schools within KCPS boundaries no longer collect FRL data due to participation in the Community Eligibility Provision, part of the National School Lunch Program. Direct certification data offers a reasonable alternative to FRL for measuring socioeconomic need at the school level. We should use it.
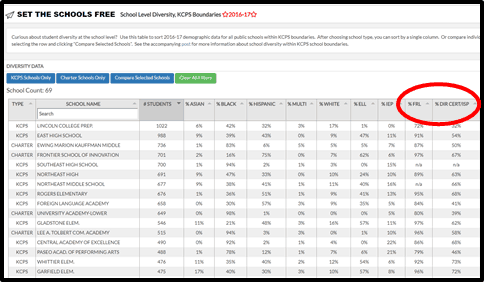
Good news! The School-Level Diversity Data Tool, launched just last month, now includes 2016-17 socioeconomic data. Previously it included only Race/Ethnicity, Individualized Education Plans (IEP/ Special Education) and English Language Learners (ELL).
I’ve added two different columns of socioeconomic data. The first column, Free and Reduced Lunch (FRL), is pretty straightforward. It’s the percentage of students at each school who qualify to receive free or reduced price lunches under federal income guidelines. A family of four is eligible for reduced-price lunch if they make under $44,955/year; for free lunch if they make under $31,590. (About 90% of students in our public schools are FRL eligible).
Until recently, FRL has been the measure used most widely to understand economic disadvantage at the school level. But because of federal-level policy and administrative changes to the National School Lunch Program, FRL is losing its usefulness as a measure for assessing individual student-level poverty.
For that reason, I’ve added a second column of data that’s increasingly being used as an alternative to FRL: the direct certification percentage.

Why is FRL no longer reliable?
In the past several years a growing number of public schools in our district have begun participating in the Community Eligibility Provision, a federal program that allows high poverty schools and school districts to serve breakfast and lunch at no cost to all students.
CEP reduces the stigma associated with receiving free or reduced prices lunches. It relieves administrative burden both on families, who no longer have to fill out applications to participate in the Free & Reduced Lunch Program, and on schools, who no longer have to collect and process individual household applications to get reimbursed. It also makes food service more efficient by removing cash from the meal transaction.
These are wins for students, families and schools.

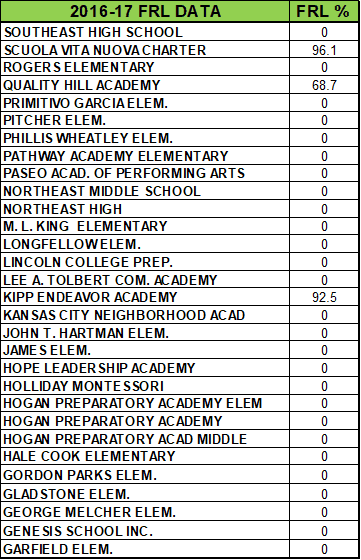
But because CEP schools are no longer collecting household applications, they no longer report FRL data. For example, if you look at DESE 2016-17 Building-level Demographic Data for public schools within KCPS boundaries, you’ll see a lot of schools – like Hope Leadership Academy, a charter, or Rogers Elementary, a KCPS school– that have “zero percent” FRL. These are CEP schools.
(For CEP schools that don’t have 2016-17 FRL data, I’ve pulled data from the most recent year available. This is the same technique I used with the Analysis of student demographics within KCPS boundaries from April 2018).
Losing accurate FRL data is problematic because it’s our primary means for understanding student economic disadvantage at the school level. Without it, we don’t have a reliable proxy for poverty in CEP schools.
And if we describe CEP schools as 100% FRL – because all students now receive free meals – it means we’re over-representing the number of economically disadvantaged students in participating schools. We lose understanding of the different contexts in which different schools operate. And we have no way of comparing, for accountability purposes, the academic achievement of higher needs students compared to their more economically advantaged classmates.
Direct certification as a potential replacement for FRL
Rather than collecting paperwork, CEP schools are now able to “directly certify” student eligibility for free and reduced-price lunches by cross-checking, via database, whether families and caregivers of students participate in state-administered, means-tested programs such as SNAP and TANF; or whether students are unaccompanied, migrant, homeless, or in the foster care system. This number of direct certification “matches” provides the basis for CEP school lunch reimbursements.
And it’s this number of “directly certified” students that’s being used, increasingly, as an alternative to FRL for understanding poverty at the school level.

In conducting research on Atlanta Public Schools’ partnership schools, for example, I noticed that Atlanta Public Schools includes the percentage of directly certified students, rather than FRL, in the individual school profiles of their Charter and Partner School Annual Report. Washington, DC is now using direct certification data to identify its at-risk student population in its new STAR school accountability system. According to a recent Brookings Institution Policy Brief, a number of other states are following suit.
The Community Eligibility Provision and Direct Certification in Kansas City
The Community Eligibility Provision rolled out nationally in 2014-15. As school participation in CEP grows it becomes increasingly important to find a reliable replacement for FRL. I’ve included direct certification data in the diversity tool, along with FRL, to help build awareness in Kansas City.
(Note: The percentage of directly certified students for each school is also called the Identified Student Percentage (ISP), which is how it shows up on DESE CEP spreadsheets.
As of 2016-17, the last year for which a complete set of demographic data is available, about 75% of public schools within the KCPS footprint were participating in CEP. This number includes 100% of KCPS schools and slightly more than half of all charter schools. Several charters were CEP-eligible (have a Direct Certification/ISP of 40% or greater) but were not yet participating; others are near-eligible.
While this level of participation is great for our students and schools, it means we no longer have FRL data for at least 3/4 of our schools.
We do, however, have a complete set of direct certification data!
A few closing thoughts
Using Direct Certification/Identified Student Percentage as a proxy for economic disadvantage at the school level isn’t without limitations. These include:
- Data accuracy depends on the strength of the state’s direct certification matching process, as well as the administrative capacity of implementing schools (charter schools, for example, may face particular challenges due to lack of capacity).
- Direct certification doesn’t capture the full universe of student need – students who would be eligible for reduced lunch, but not for SNAP, for example. (For this reason, states use a multiplier of 1.6 to determine school eligibility for lunch reimbursement).
- It doesn’t capture families who may be eligible for SNAP or TANF but aren’t participating in these programs. For example, direct certification will under-report student poverty at schools with higher numbers of undocumented immigrants.
The bottom line, though, is that FRL is no longer enough to quantify student need at the school level. We need something more precise.
Direct Certification/Identified Student Percentage may or may not be the long-term fix to replace FRL, either nationally or for the state of Missouri. But in the meantime these publicly available data give us important, more recent, and slightly more nuanced socioeconomic information about the students our schools are serving. We should use it.
________________________
This post represents my best attempt at explaining a pretty significant national policy change and what it means for us locally;
it’s new territory for Set the Schools Free. If you have other useful information or ideas to contribute to the conversation, please leave a comment below – I’d love to hear from you.
And now a Public Service Announcement…
Is your school taking advantage of CEP? If you’re not sure, you should check. Under federal law, states are required to post, on an annual basis, a list of schools that are CEP eligible or near-eligible. You can find this information for the state of Missouri here. Note that just because a school is CEP-eligible doesn’t mean it automatically participates in the program.
(For schools that are *not* CEP near-eligible and don’t show up on the list, data in the diversity sorting tool comes directly from DESE).
If your school, or a school you serve, has a lower direct certification percentage than you expect, it’s worth looking into why that is. It’s possible that families and caregivers aren’t taking advantage of programs for which they’re eligible. Or, that your school needs to improve its administrative processes supporting direct certification. Happily, with some effort, these challenges can be addressed.
Here are a few additional resources if you’re interested in learning more:
- https://www.usnews.com/news/education-news/articles/2019-01-07/why-its-getting-harder-to-count-poor-children-in-the-nations-schools
- https://www.future-ed.org/how-states-measure-poverty-in-schools/
- https://www.brookings.edu/research/a-promising-alternative-to-subsidized-lunch-receipt-as-a-measure-of-student-poverty/
- http://frac.org/wp-content/uploads/direct-cert-improves-low-income-school-meal-access.pdf
- https://dese.mo.gov/financial-admin-services/food-nutrition-services/community-eligibility-provision-cep
- https://www.fns.usda.gov/community-eligibility-provision-resource-center
- https://gosa.georgia.gov/changes-freereduced-priced-lunch-measure-student-poverty

Thank you for this valuable information.
Thanks so much for your comment, Hayley. I’m really glad you find the information useful.